

Listen Now
Why Some Industrial Companies Never Escape the Valuation Trap – and What Separates Them from Those That Do
Walk through any micro-vertical of industrials – electrical equipment, flow control, specialty materials – and you will find two types of companies sitting side by side. Both make real things, serve real customers, and have been around for decades. Yet one has quietly compounded its market cap three, four, or five times over. The other is still where it was, priced like a commodity, invisible to institutional investors.
This is not a story about industry dynamics or end market luck. It is about a small number of specific, observable decisions – on pricing, portfolio, capital allocation, and leadership – that compound quietly over years until the gap becomes almost impossible to close.
From a universe of 900+ publicly traded US industrial companies, we studied the 315 with market caps between $100M and $5B over the last five years. We identified two cohorts: 43 Value Trappers – companies that stayed below $1B in market cap for five years and grew less than 50% – and 18 Value Builders – companies that started below $1B in January 2021 and have since crossed $1.5B or more. The differences are measurable, structural, and traceable to decisions that diverge early and compound hard.
THE DIVERGENCE
Two Cohorts, One Compounding Gap
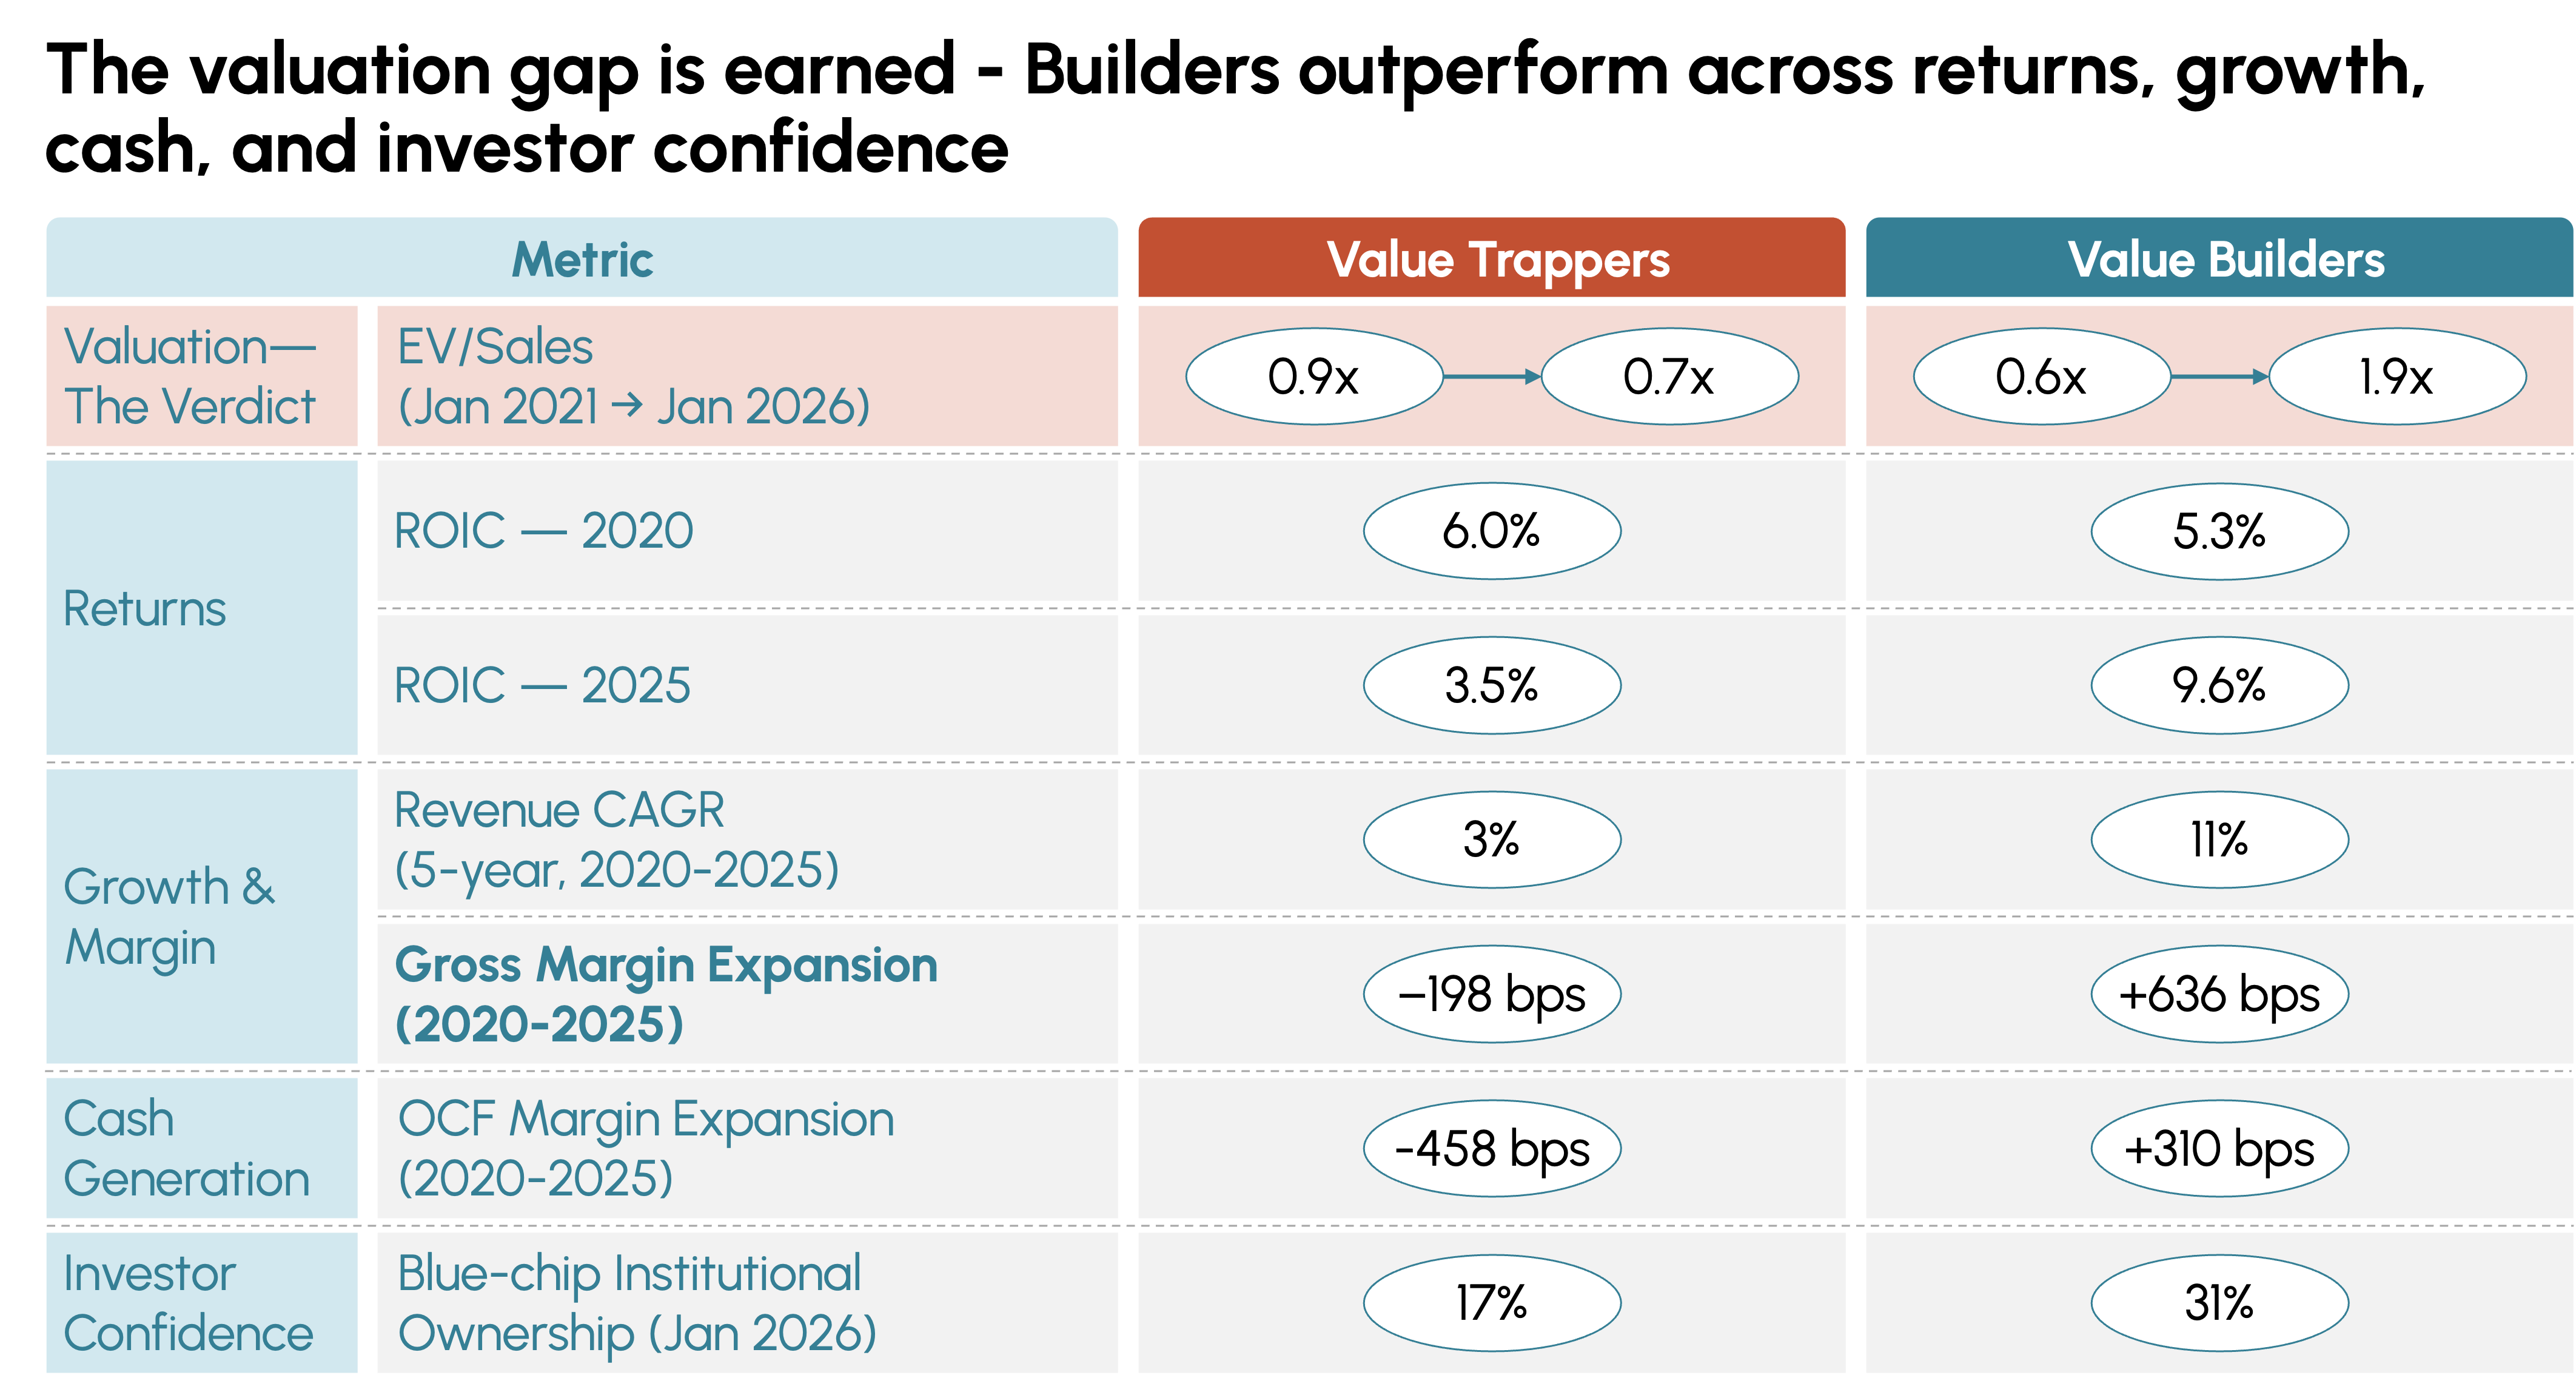
In January 2021, Trappers traded at 0.9x EV/Sales and Builders at 0.6x. By January 2026, Trappers had slipped to 0.7x while Builders expanded to 1.9x. That re-rating – one cohort compressing, the other tripling – was built in real time as business quality diverged across four dimensions:
- Returns: Trapper ROIC collapsed from 6.0% to 3.5%; Builder ROIC climbed from 5.3% to 9.6%.
- Growth and margin: Builders grew revenue at an 11% CAGR vs. 3% for Trappers and expanded gross margins by 636 bps while Trappers surrendered 198 bps.
- Cash generation: Builders expanded OCF margin by 310 bps; Trappers saw theirs shrink by 458 bps.
- Institutional ownership: Blue-chip institutions own 31% of Builder equity vs. 17% of Trapper equity – a gap that reflects strategic predictability, not just performance.
Exhibit 1
WHAT SETS VALUE BUILDERS APART
The Five Tenets
Tenet 1: The Margin Engine
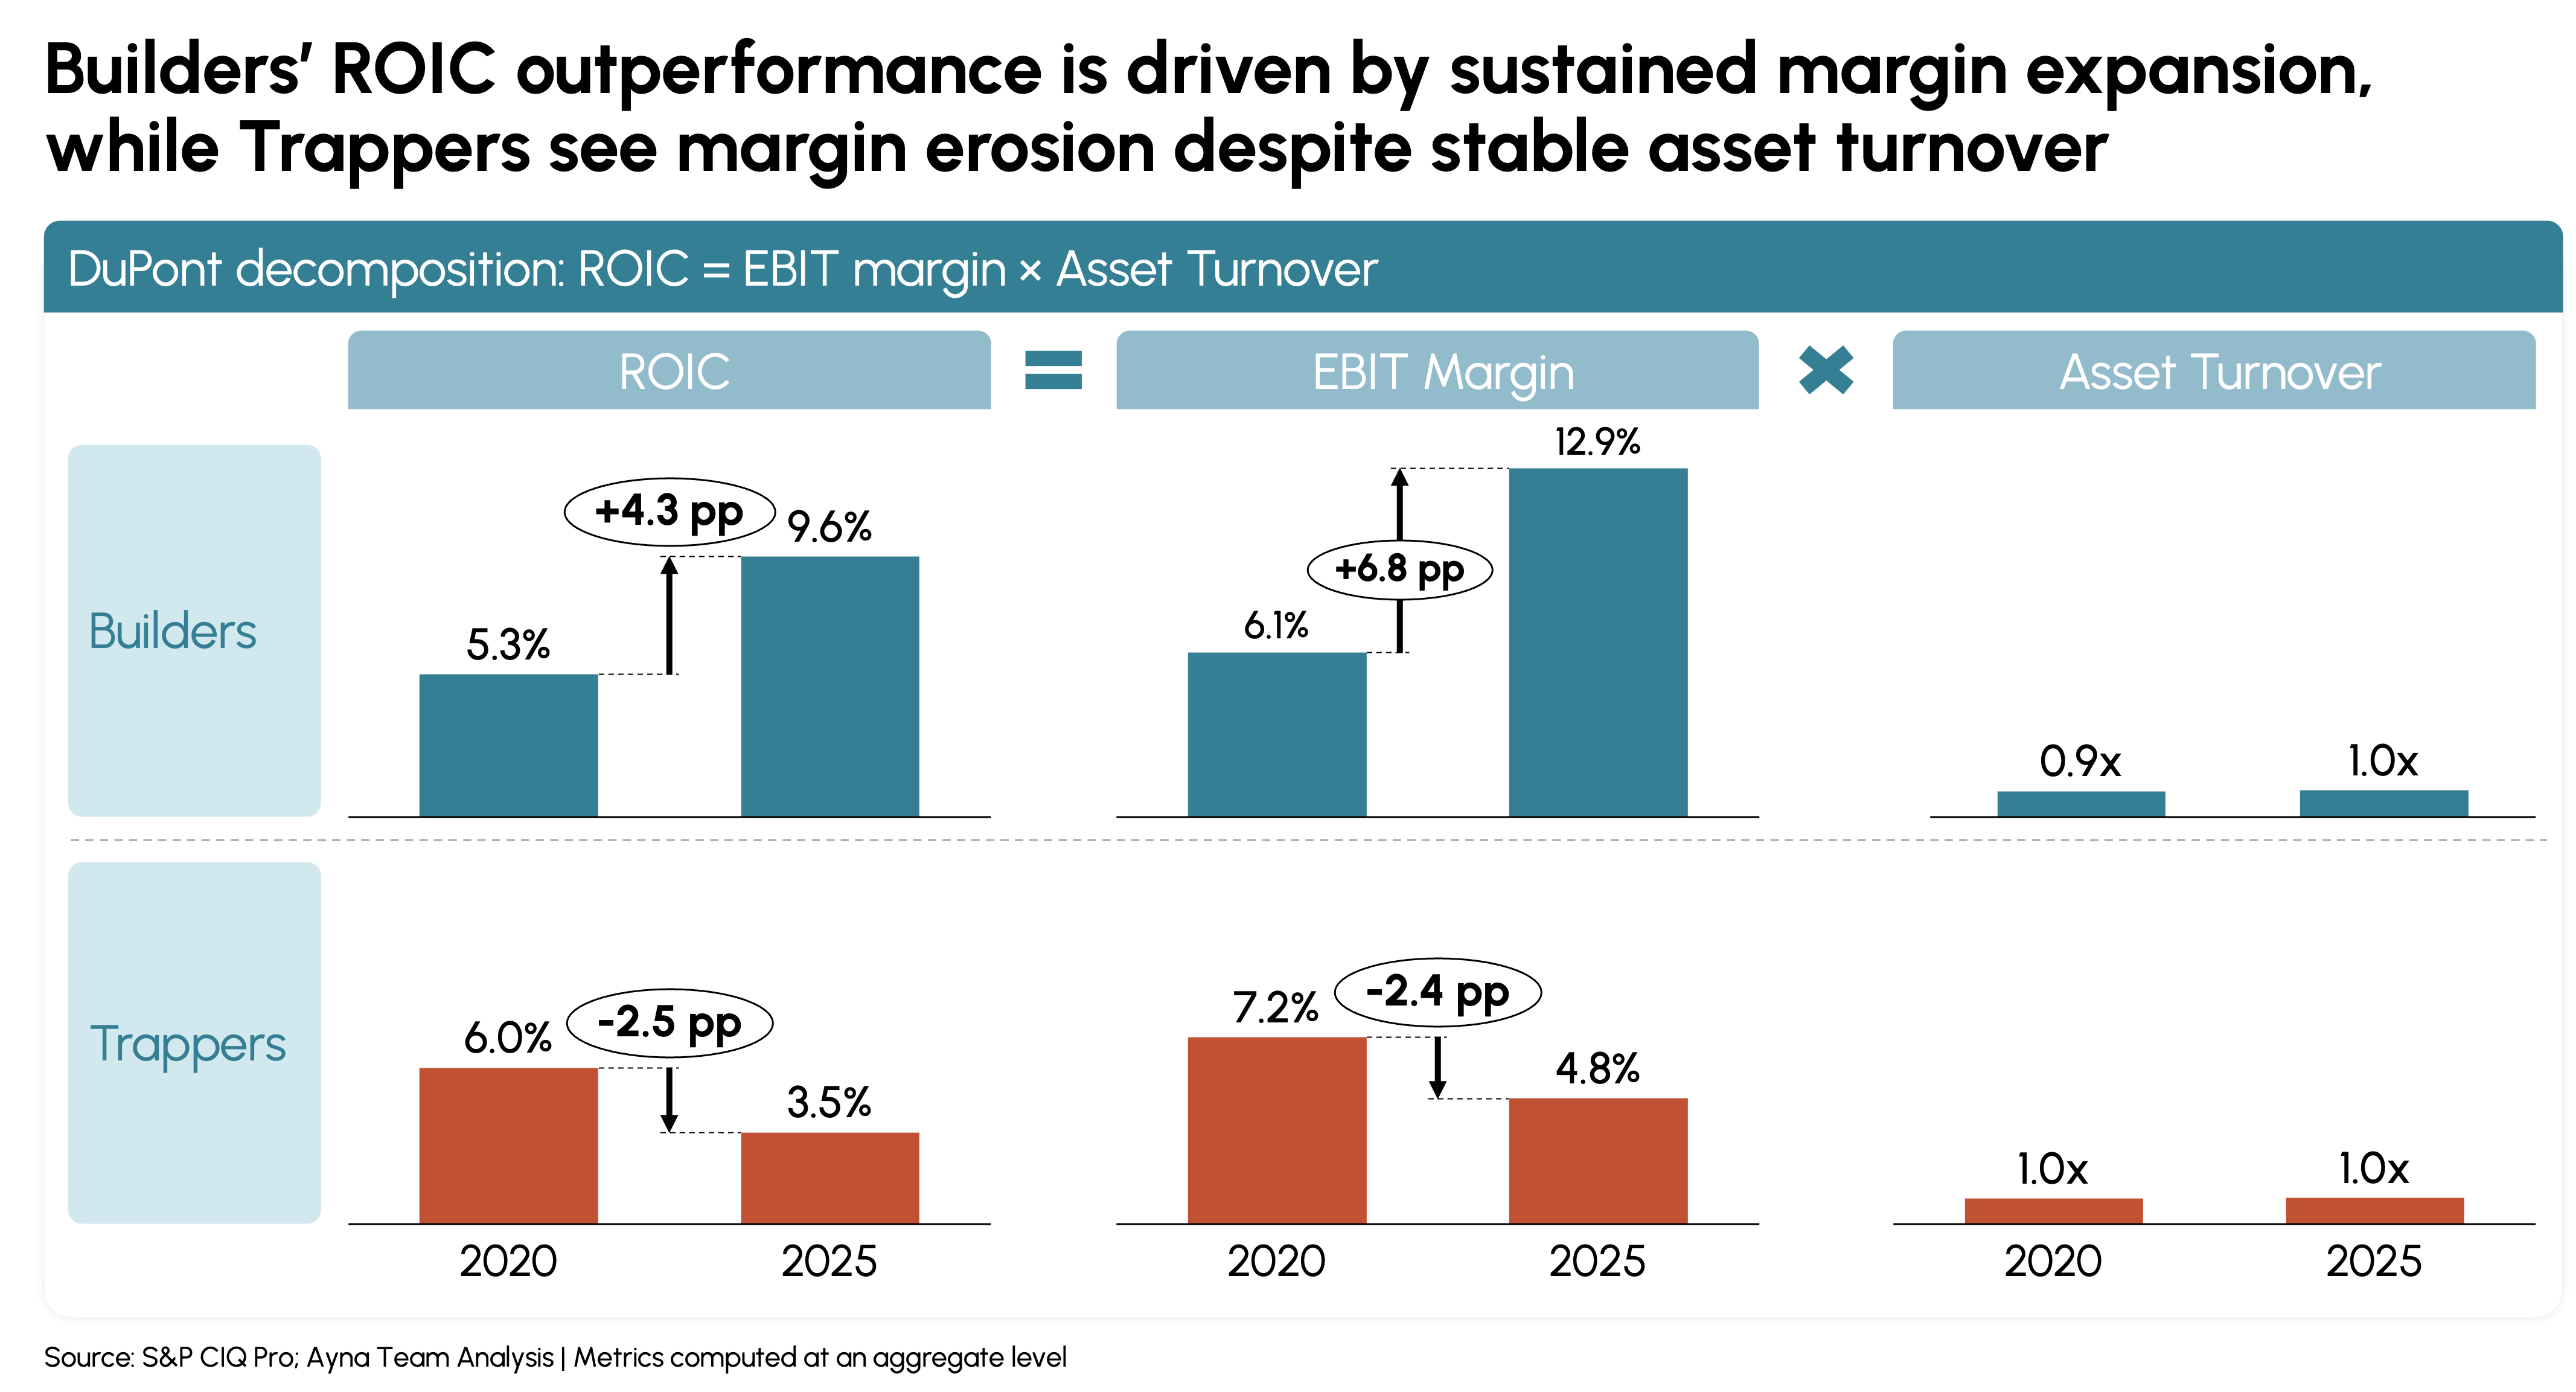
The sharpest separator between the two cohorts is ROIC trajectory. Both groups entered 2020 at similar levels. From there they diverged consistently over five years. Builder EBIT margin expanded from 6.1% to 12.9% – a 6.8 pp improvement. Trapper EBIT margin contracted from 7.2% to 4.8%. The gap lives on the income statement, not the asset base: asset turnover is nearly identical across both cohorts. Trappers compete on price to hold volume, accepting discounts rather than defending the value their products deliver. Every discount compounds – a point of gross margin surrendered in year one is a point that never returns.
Exhibit 2
Tenet 2: The Market Selection Advantage
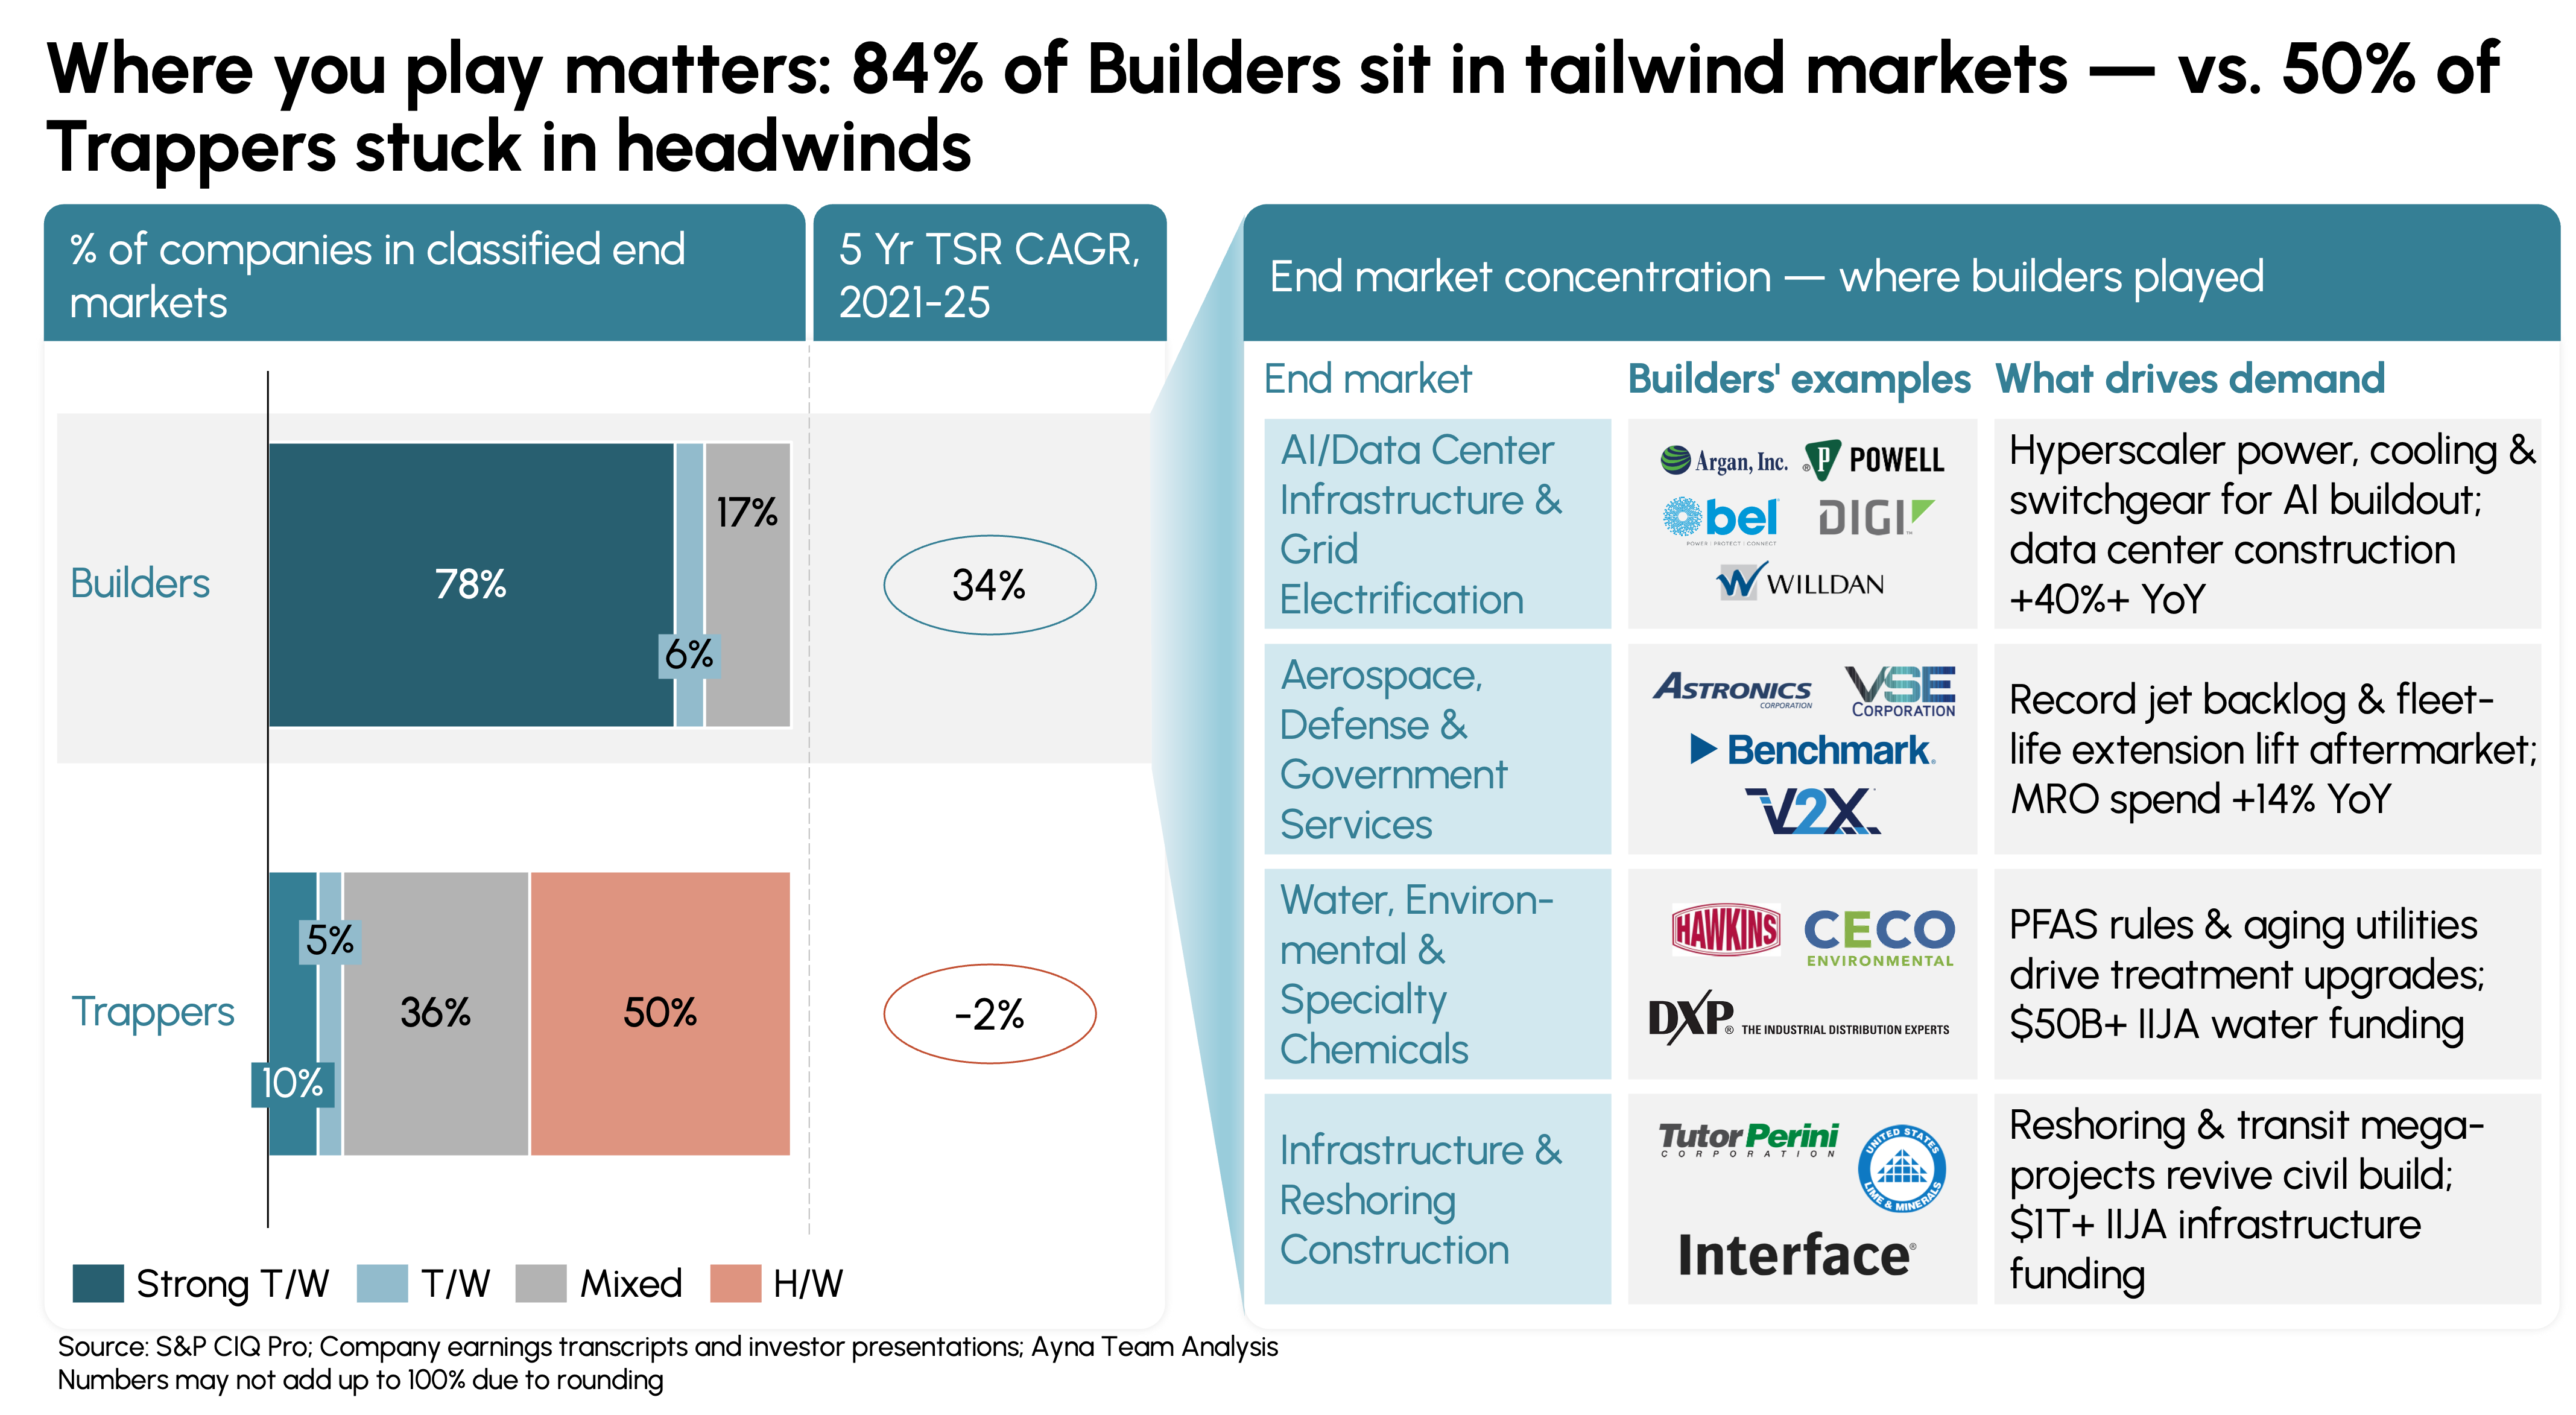
The margin gap does not begin with execution – it begins with the choice of where to compete. Builders orient toward structurally growing end markets: energy infrastructure, aerospace MRO, water treatment, defense electronics. Trappers accumulate exposure to commodity, cyclical, and secular-decline markets: commercial print, auto OEM parts, recreational boats, pulp and paper.
On a revenue-weighted basis, Builders derived 80% of revenue from tailwind end markets; Trappers averaged just 14%. Not a single Builder was classified as a headwind company – while half of Trappers were. Builders compounded at a 34% five-year TSR CAGR; Trappers declined at −2%.
Exhibit 3
Tenet 3: Portfolio Discipline
Builders concentrate to compound. Trappers diversify to dilute. Rather than doubling down in a structural tailwind, Trappers expand outward – acquiring adjacent businesses, adding product lines that stretch the portfolio thin, and paying integration costs that destroy the margin structure of the core. The data is precise: in the year before peak deal activity, Trapper gross margin sits at 26.8%. By the year after, it has fallen 153 bps. The asset base got bigger; the return on it did not.
Tenet 4: The Cash Conversion Gap
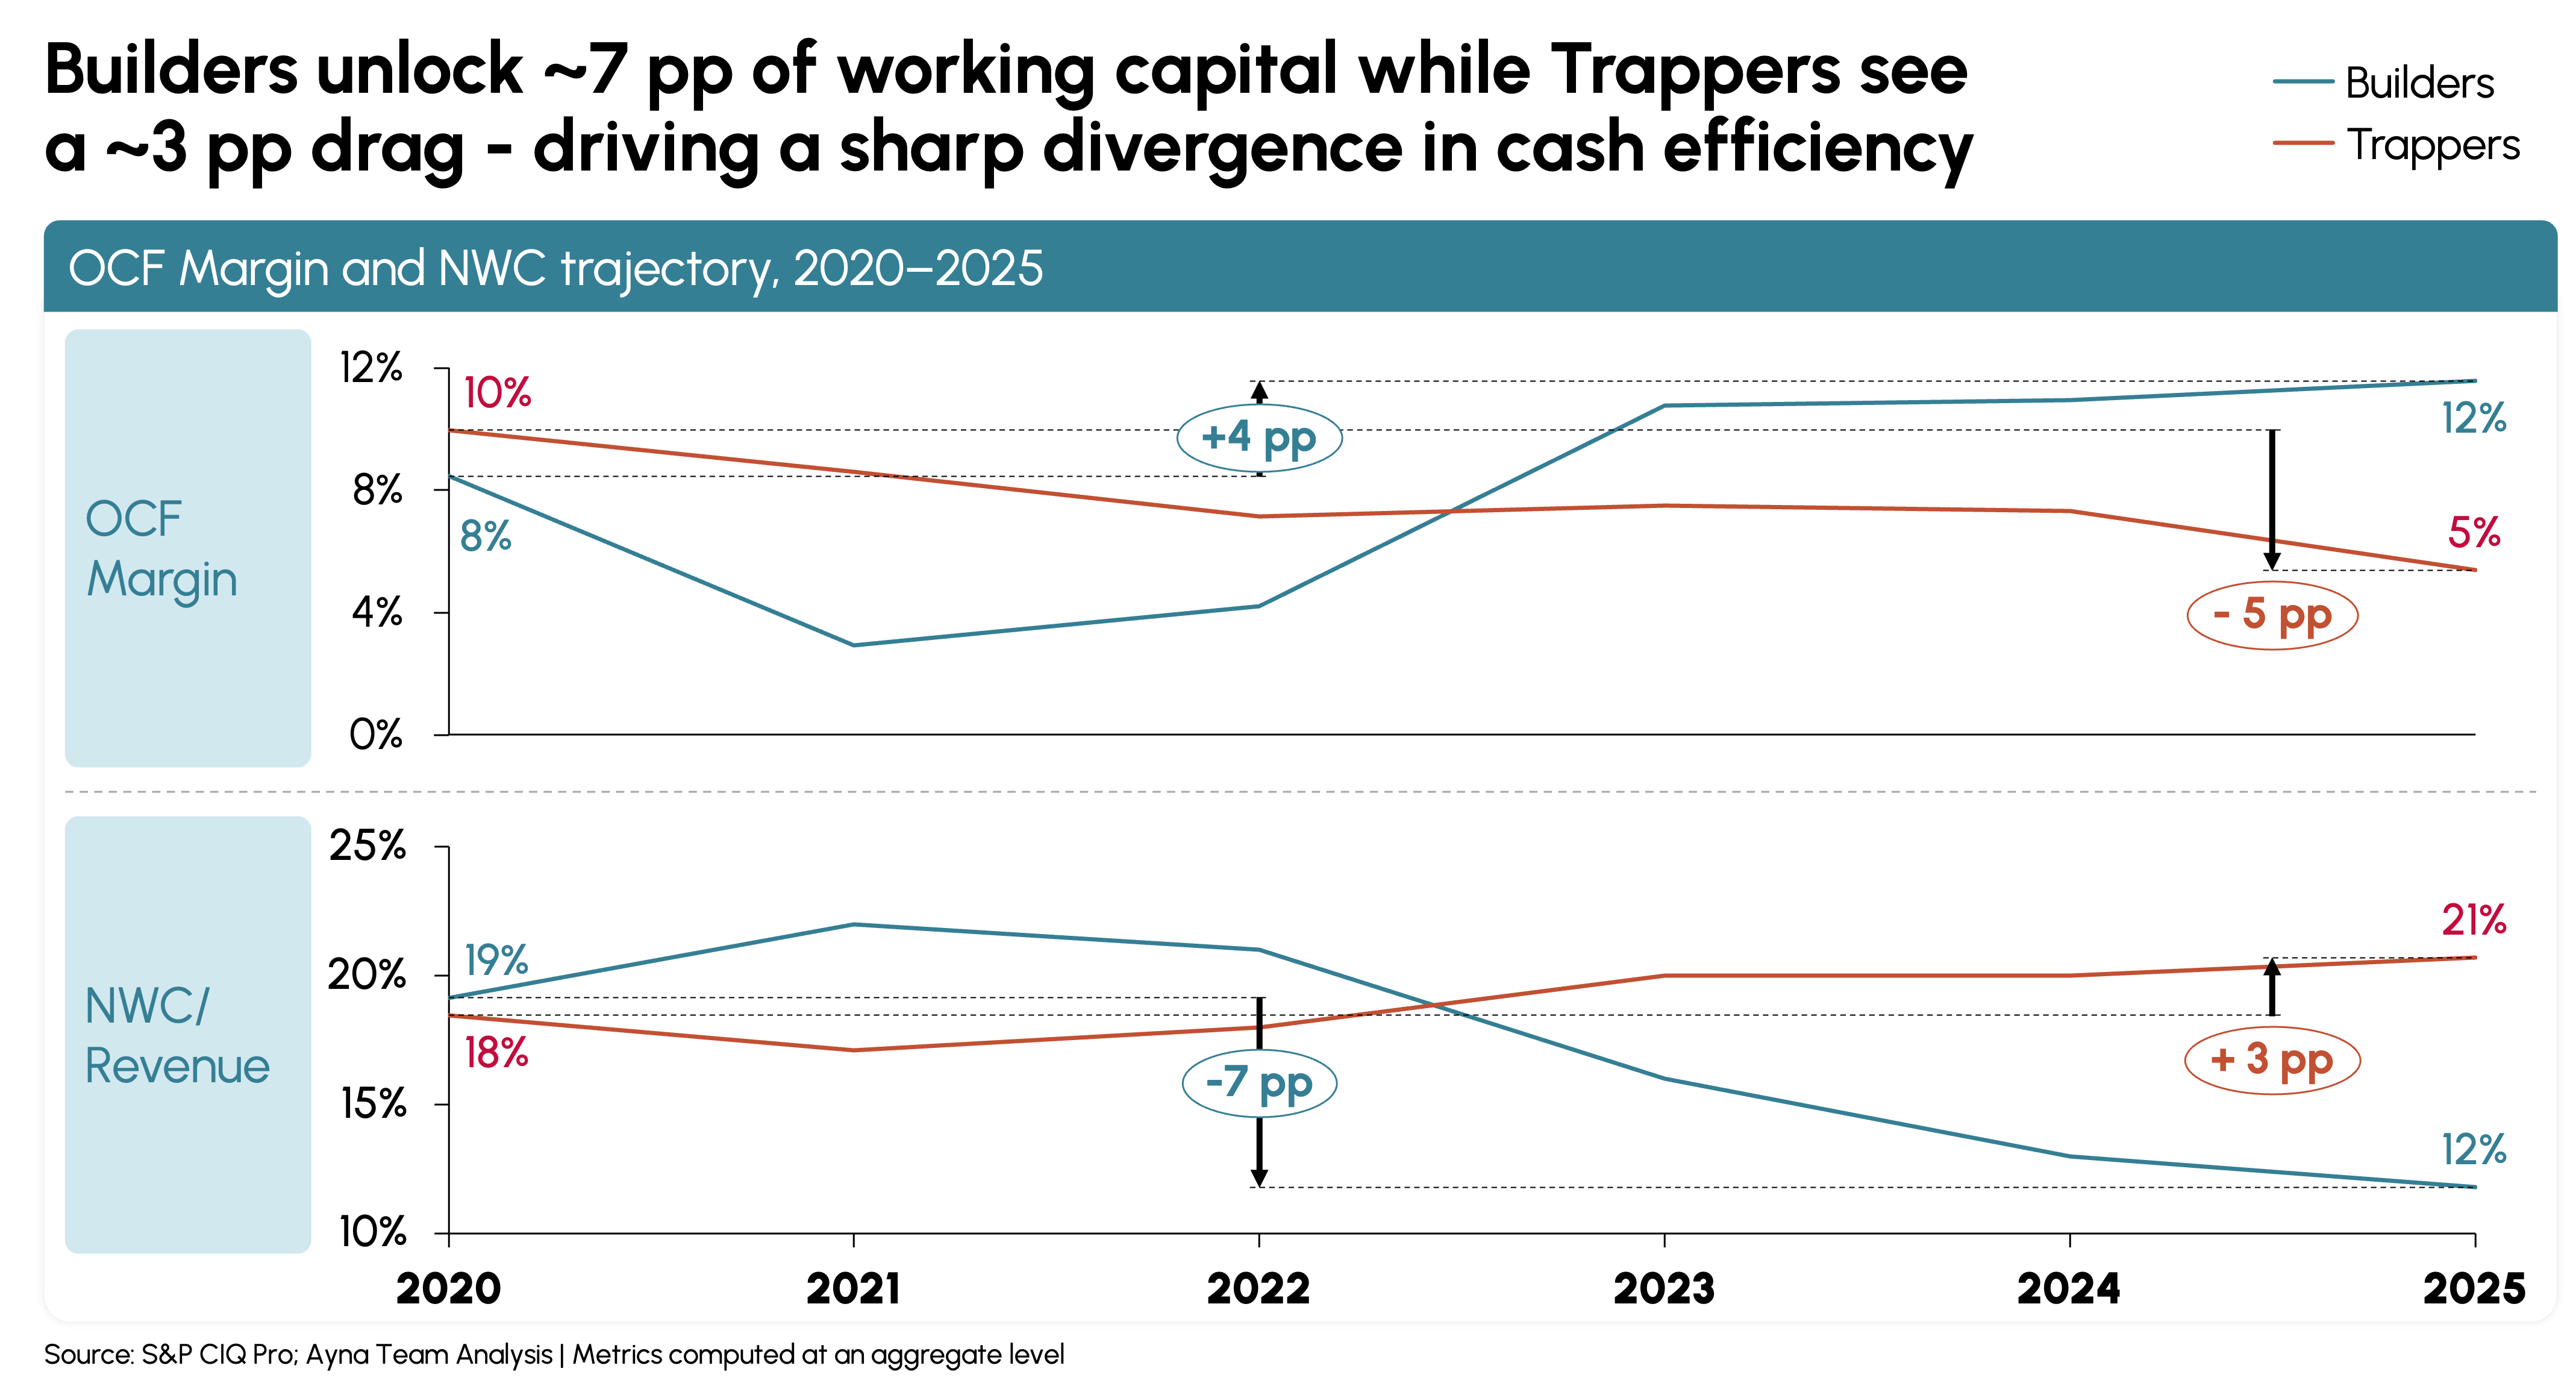
Builders collect what they earn. Trappers leave it on the table. Between 2020 and 2025, Builders reduced net working capital from 19% to 12% of revenue – a 7-pp release that lifted OCF margin from 8% to 12%. Trappers allowed NWC to drift from 18% to 21%, compressing OCF margin from 10% to 5%. Builder companies met or beat consensus EPS estimates in 2.3 of the last 5 fiscal years; Trapper companies managed just 1.4 of 5.
Exhibit 4
Tenet 5: The Credibility Compound
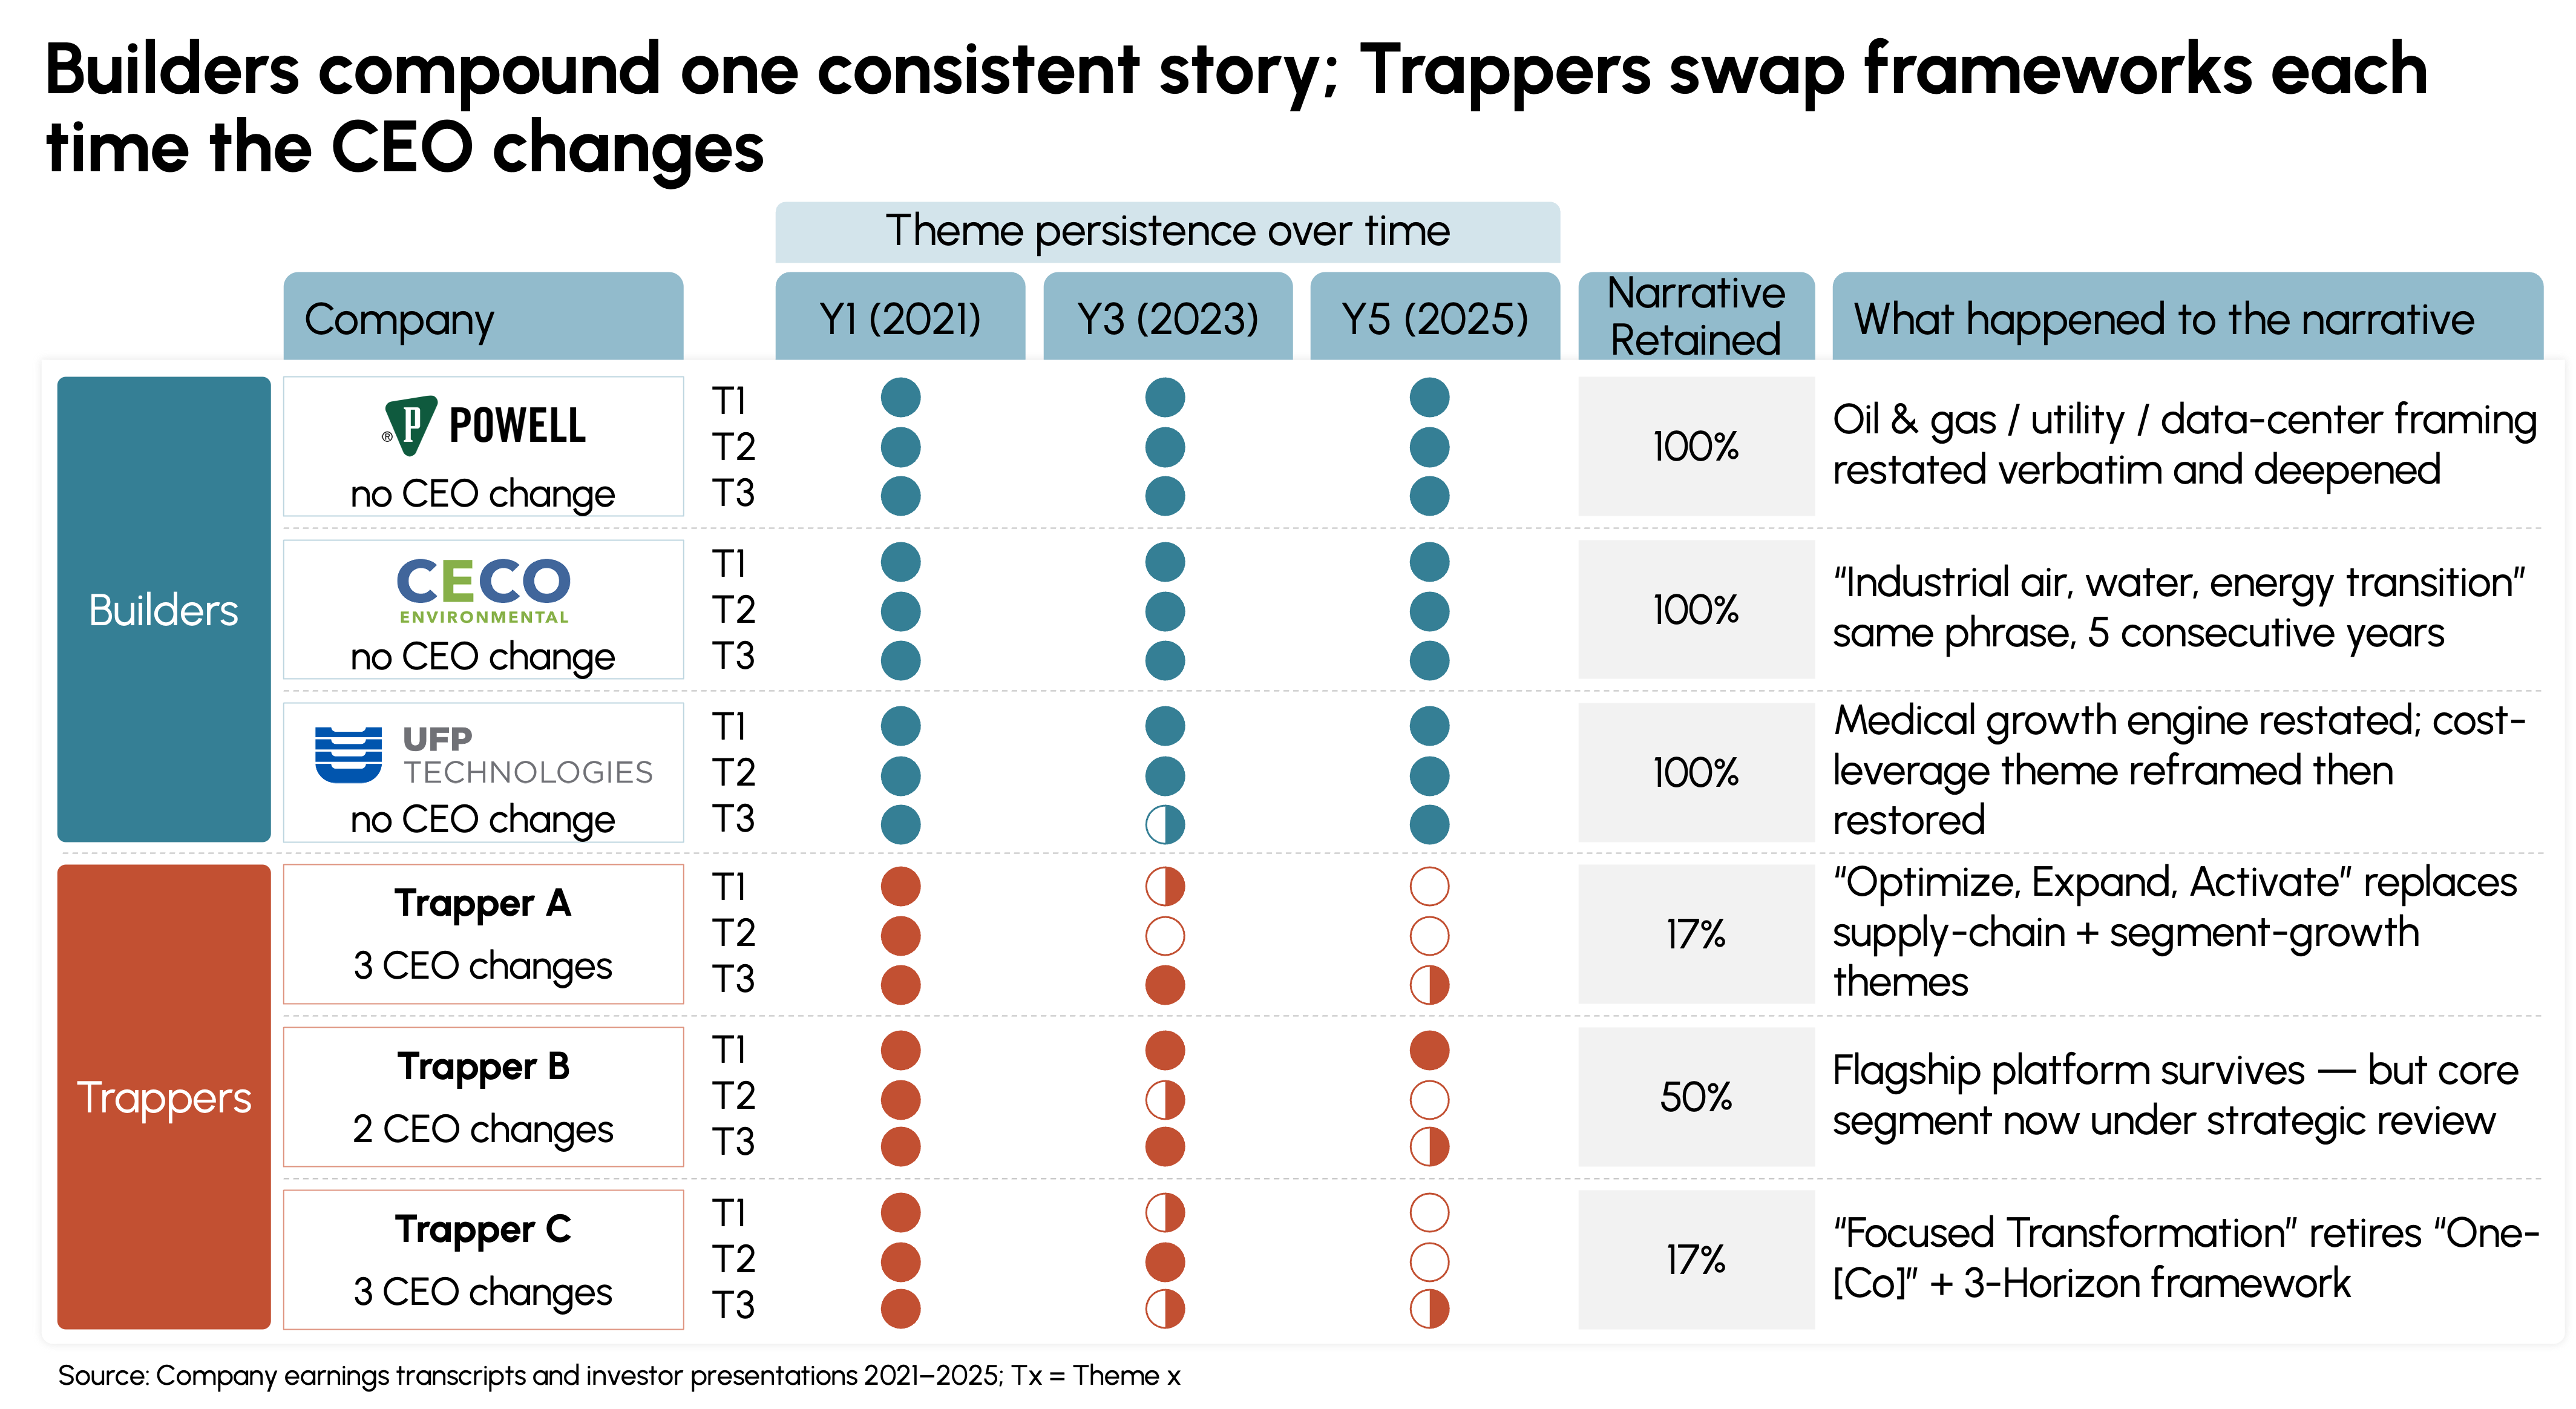
Strategy consistency is priced into the multiple. Builder CEOs averaged 12 years in the role; Trapper CEOs averaged 8. An analysis of earnings calls across both cohorts found all three sample Builders retained 100% of their year-one strategic themes by 2025. Trapper theme persistence collapsed to 28% by year five – driven almost entirely by CEO transitions. Among the Global Top 20 institutional investors, Builders command 31.0% average shareholding vs. 17.2% for Trappers – a gap that started nearly even in 2016 and widened every year since.
Exhibit 5
HOW TO CLOSE THE GAP
The Value Builder Playbook: Five Plays
Play 1: Reposition into Markets That Reward Differentiation
Map revenue against structural demand signals. If more than half sits in markets with volume decline, overcapacity, or commodity pricing, repositioning is the prerequisite for every move that follows. Powell Industries concentrated on oil and gas, utility, and data centers — and was already in place when those markets accelerated. Market cap grew from $340M to $3.9B in five years.
Play 2: Build Differentiation That Lets You Price on Value, Not Cost
Invest in switching costs, application engineering, and certifications before attempting to raise price. Only 1 in 5 industrial companies that announced increases in 2025 captured 150 bps or more of gross margin expansion. Pricing power is earned – it cannot be declared. Hawkins passed through 2022 cost spikes without volume loss because its customers had no credible alternative for its certified formulations.
Play 3: Convert Margin Gains into Cash by Tightening Working Capital
Run a DIO/DSO/DPO diagnostic by site and target 200–400 bps of OCF release within 12 months. Start with DSO. Publish an explicit capital allocation hierarchy – organic investment first, acquisitions into tailwinds second, buybacks only when neither clears the hurdle – and state it publicly. Argan's fixed-price EPC contracts collect cash from utilities before cost hits the income statement; the business grew from $700M to $4.3B on that structural advantage.
Play 4: Divest to the Point of Genuine Excellence
Score every business unit on gross margin relative to the core and end-market structural demand. Exit anything that fails both tests within 18 months. Ring-fence proceeds until margin improvement is visible in at least two reported quarters. Bel Fuse divested out of consumer and networking, refocused on defense electronics and medical power, and delivered 12x returns from 2021 to 2026.
Play 5: Build the Investor Infrastructure to Capture the Multiple
Identify the 5–8 sector analysts whose coverage determines whether a long-duration fund can build a position. Pick three public commitments – a margin target, a working capital ratio, a capital allocation rule – and report against them every quarter. Lock the narrative to three end-market themes and do not change them. Powell held the same three themes in every earnings call from 2021 to 2025. The re-rating from 0.6x to over 4x EV/Sales was an outcome investors had already modeled.
Source: S&P Capital IQ, earnings call transcripts, Ayna analysis.
The companies in our Builder cohort did not start with structural advantages unavailable to their peers. What separated them was not luck or industry tailwind. It was a set of decisions made early, held consistently, and compounded over time. The rest is arithmetic.
Photo by Arturo Añez on Unsplash