Listen Now
The United States has driven more semiconductor value creation over the past decade than any other country in the world. US firms have amassed 70 percent of global semiconductor market cap growth by anchoring themselves in R&D-intensive segments: electronic design automation (EDA), fabless chip design, and semiconductor equipment. This strategy has generated extraordinary returns and positioned American companies at the center of the global technology ecosystem.
As industry races toward $1.3+ trillion in annual revenue by 2030, the US holds the innovation, the leadership in next-generation technologies, and the ecosystem depth to lead that next era. Sustaining that position requires pairing those advantages with domestic manufacturing capacity that has gradually lagged as capital flowed toward EDA, fabless design, and semiconductor equipment over several decades.
This report provides an in-depth review of the competitive dynamics shaping the global semiconductor industry, assesses the execution risks that threaten the CHIPS Act buildout, and outlines six critical priorities for firms, investors, and policymakers seeking to secure US leadership into the next decade.
US Semiconductor Competitive Dynamics
How R&D Investment Drives Market Leadership
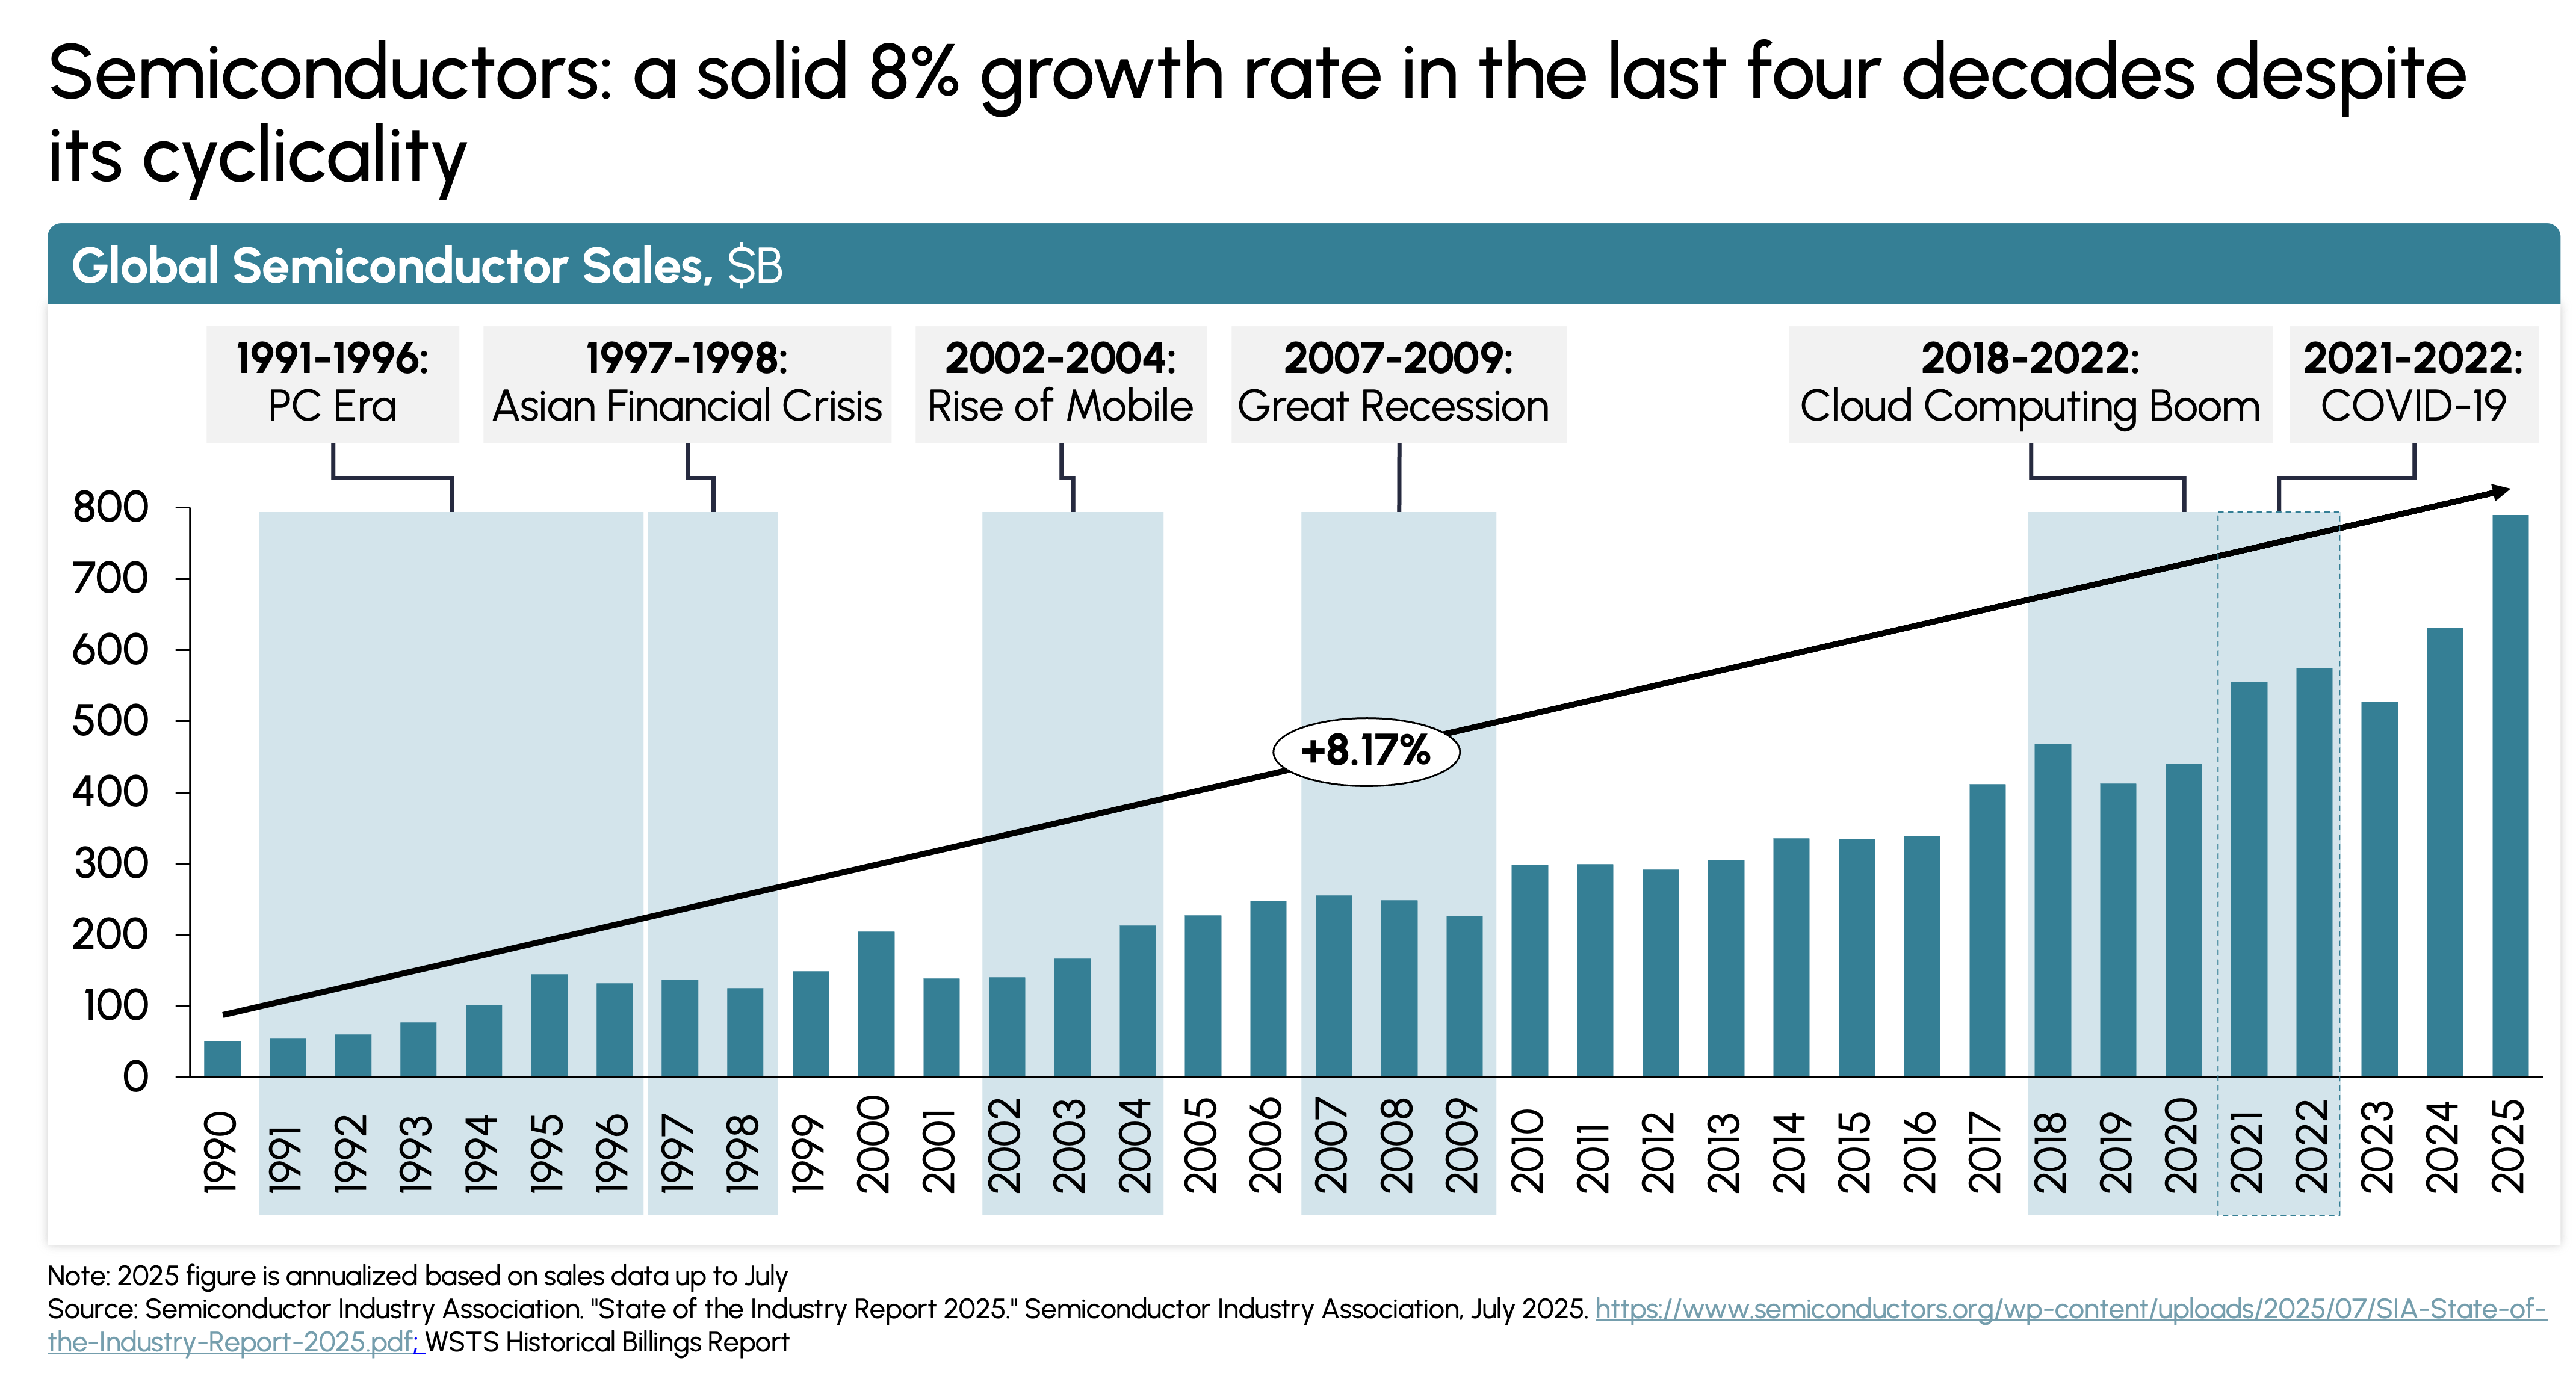
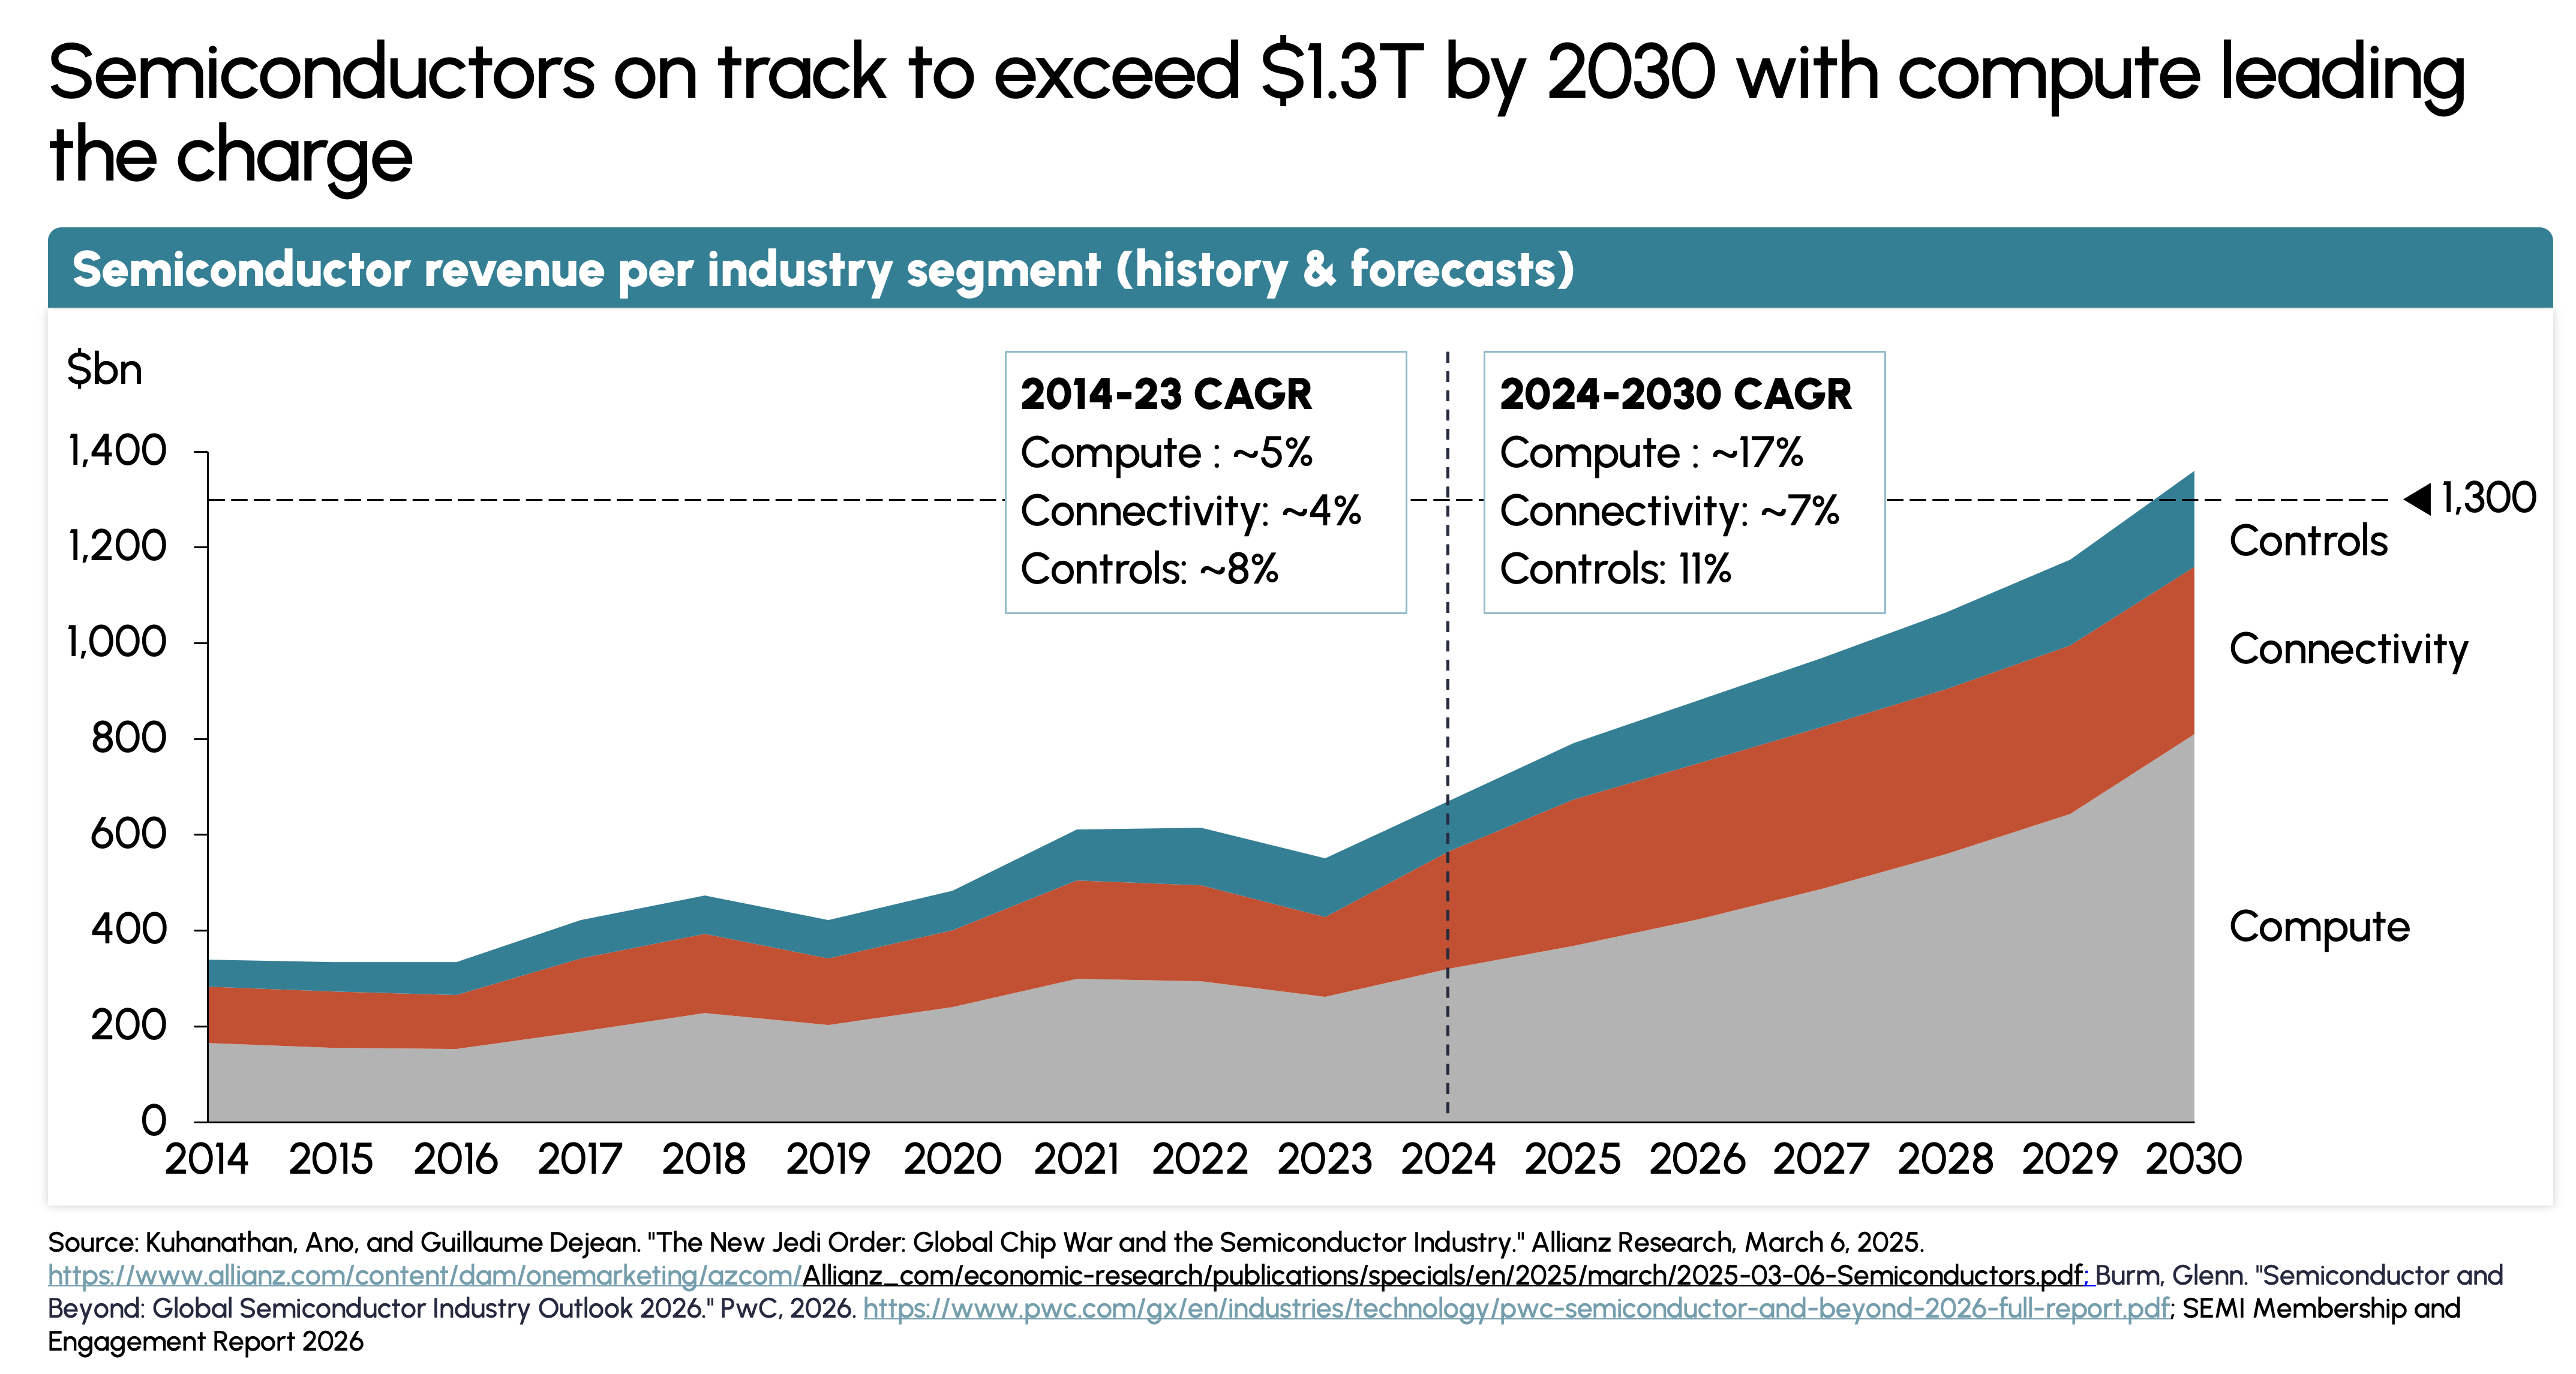
The semiconductor industry, despite its cyclicality, has delivered consistent growth over three decades. Since 1990, global sales have grown at roughly 8 percent CAGR, outpacing global GDP growth by approximately 3x. That trajectory brought the industry to $627 billion in 2024, and projections point toward $1.3+ trillion in annual revenue by 2030.1,2
The current cycle looks different. Generative AI chips exceeded $125 billion in revenue in 2024, surpassed $150 billion in 2025, and are projected to approach $500 billion by 2026 as hyperscaler buildouts accelerate. The industry is on track to sustain a compound annual growth rate above 10 percent from 2025 to 2030 (Exhibit 1).3,4
Exhibit 1
A Globally Distributed Value Chain
The semiconductor industry operates through a specialized value chain spanning seven interconnected segments. It begins with design, where firms provide intellectual property, consulting services, and automation tools. Fabless design firms architect full system-on-chip (SoC) designs and send them to foundries. Integrated device manufacturers like Intel control the full process from design through final product. No single country controls the full semiconductor stack.
US Dominance in R&D-Driven Segments
US semiconductor leadership is now built on a commanding position in asset-light, R&D-driven segments where IP and architecture compound into outsized market value. EDA leaders Synopsys and Cadence each sustain gross margins above 80 percent. Fabless firms like NVIDIA, AMD, and Qualcomm invest 20 to 30 percent of revenue in R&D to stay ahead of each design cycle.5
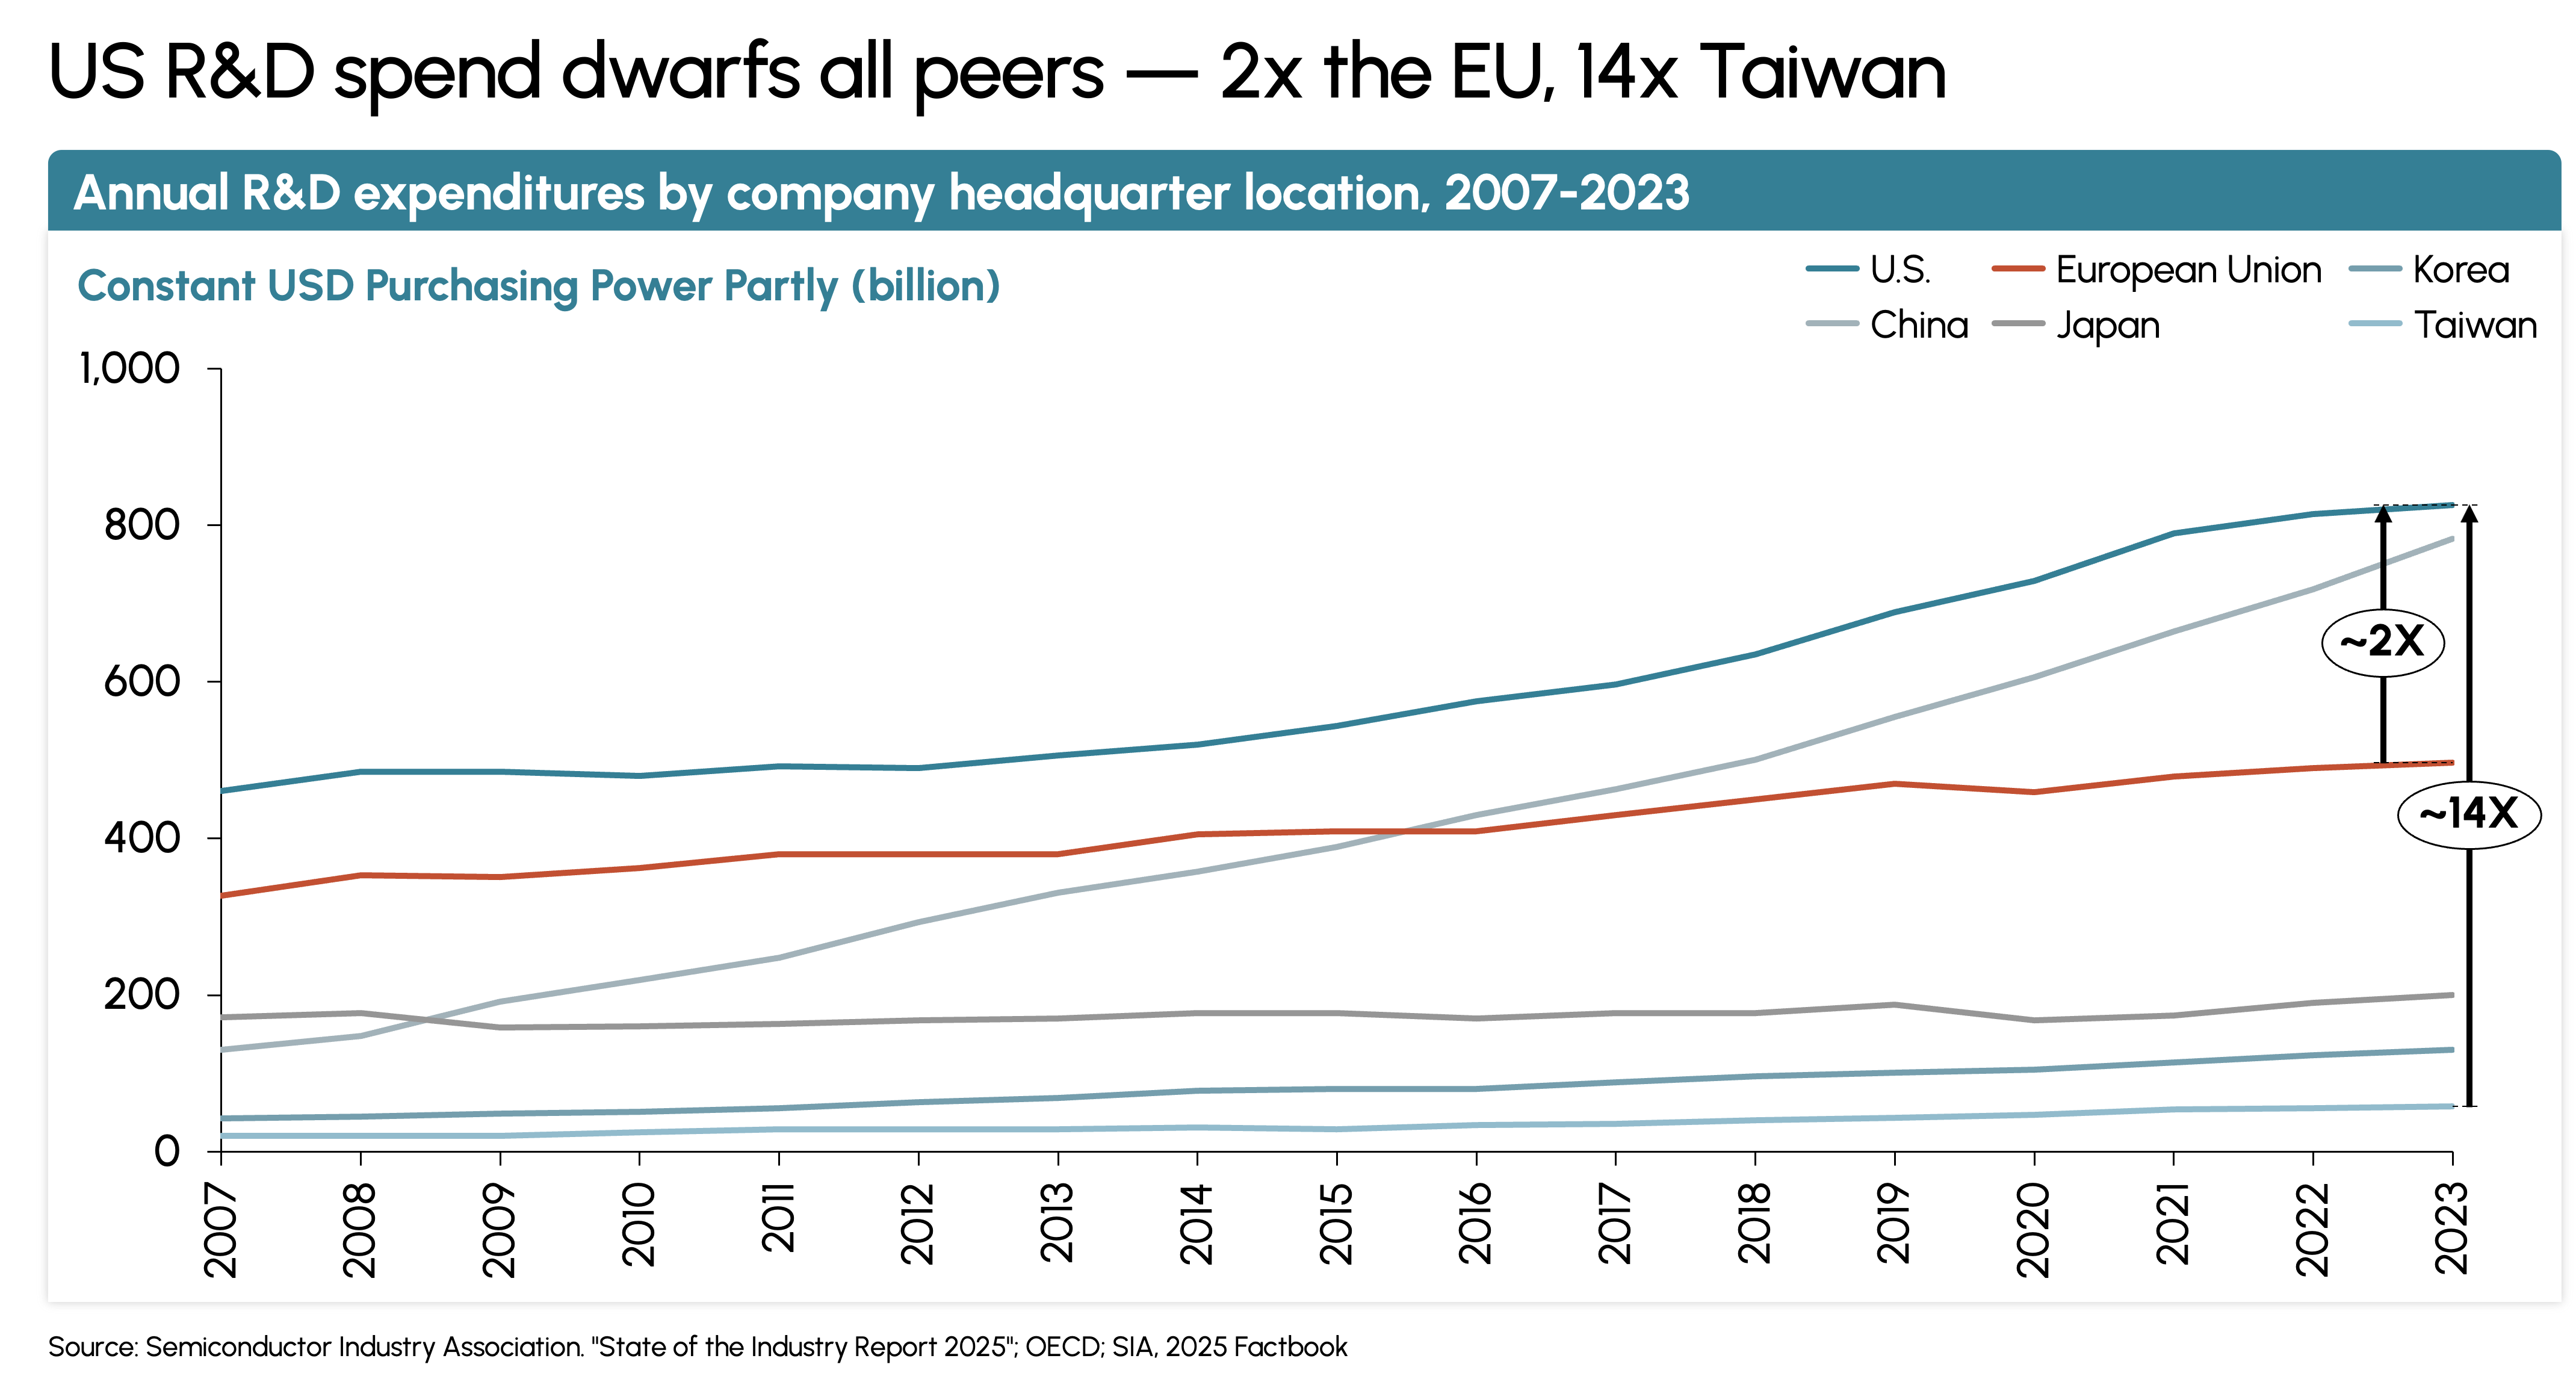
US firms invest roughly 18 percent of revenues in R&D—approximately twice Europe’s rate and 14 times Taiwan’s. The US leads global semiconductor R&D spending by a wide margin (Exhibit 2). China has grown its R&D spending significantly over the past decade and now ranks second globally, but the gap remains enormous.
Exhibit 2
US Firms Dominate Global Semiconductor Value Creation
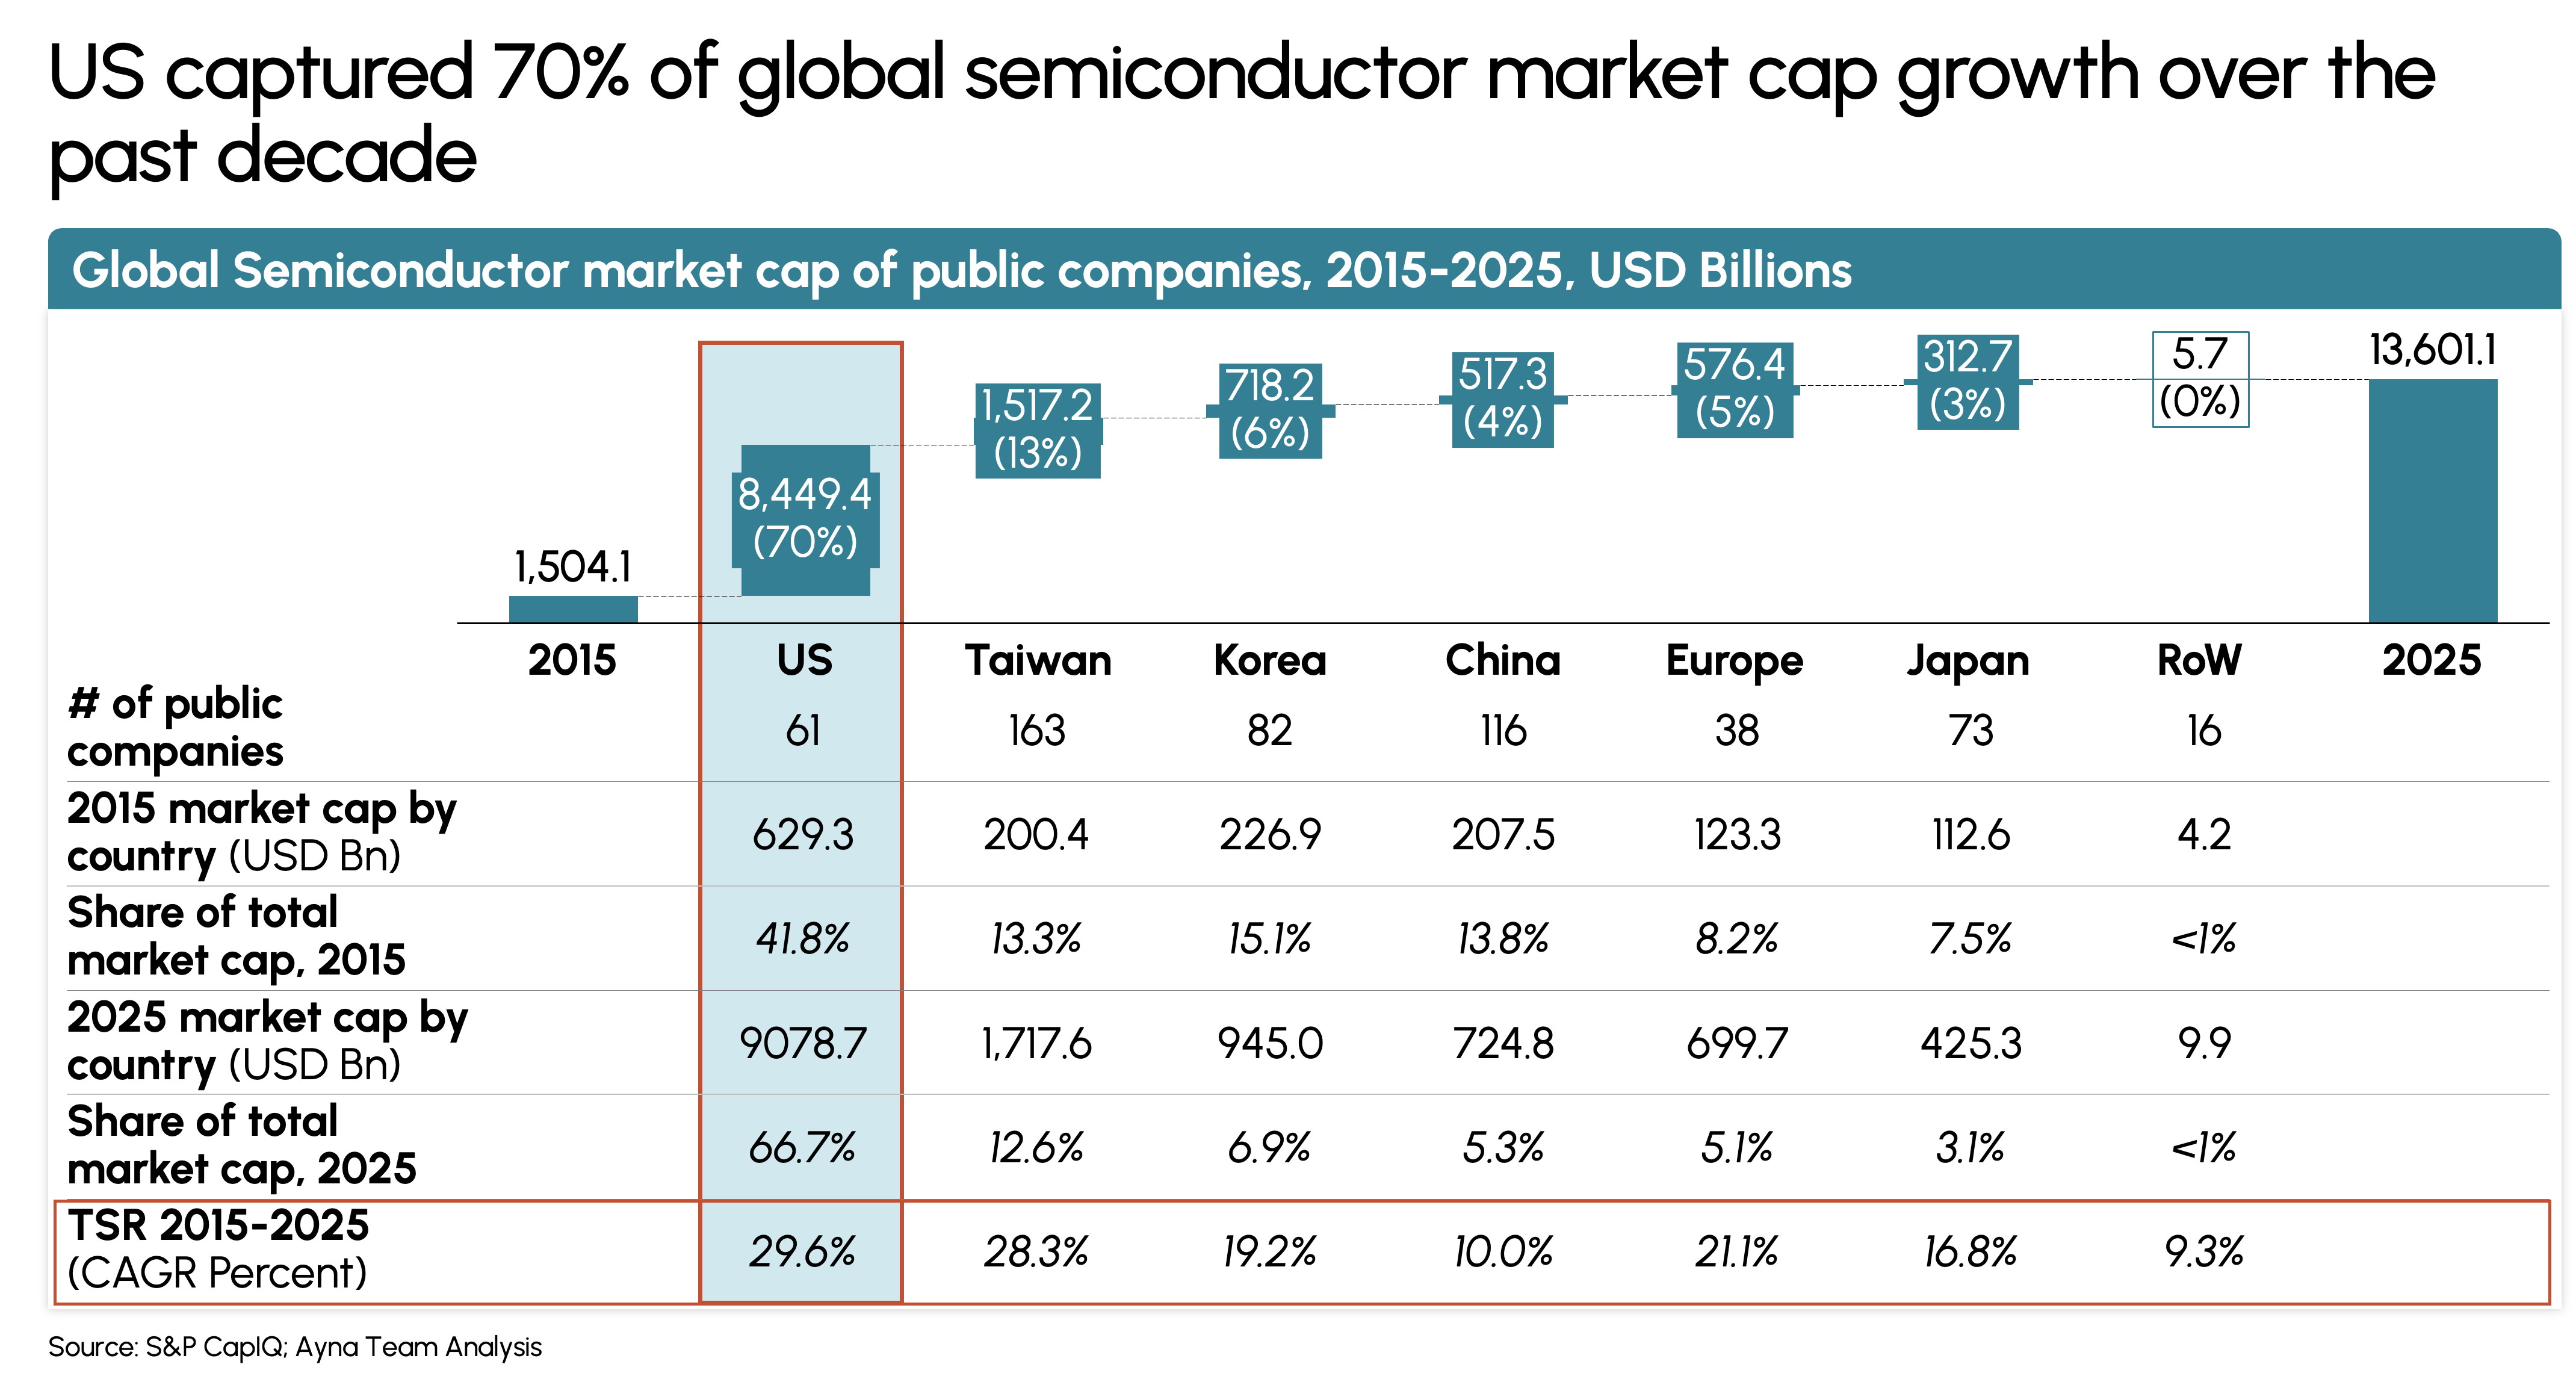
US semiconductor companies have captured 70 percent of global market cap growth over the past decade (Exhibit 3). US firms grew from $629 billion in combined market cap in 2015 to $9.1 trillion by 2025—a ~30 percent total shareholder return CAGR that outpaced every other geography. Taiwan, the second largest contributor, accounted for just 13 percent of global growth despite hosting the world’s leading foundry. China contributed 4 percent; Korea and Europe each around 4 to 6 percent.6
The US advantage is structural: by anchoring in EDA, fabless chip design, and semiconductor equipment—the segments with the highest R&D intensity and lowest capital requirements—American firms compounded IP advantage into market value at a pace the rest of the world could not match.
Exhibit 3
The Fabless Advantage and the Manufacturing Gap
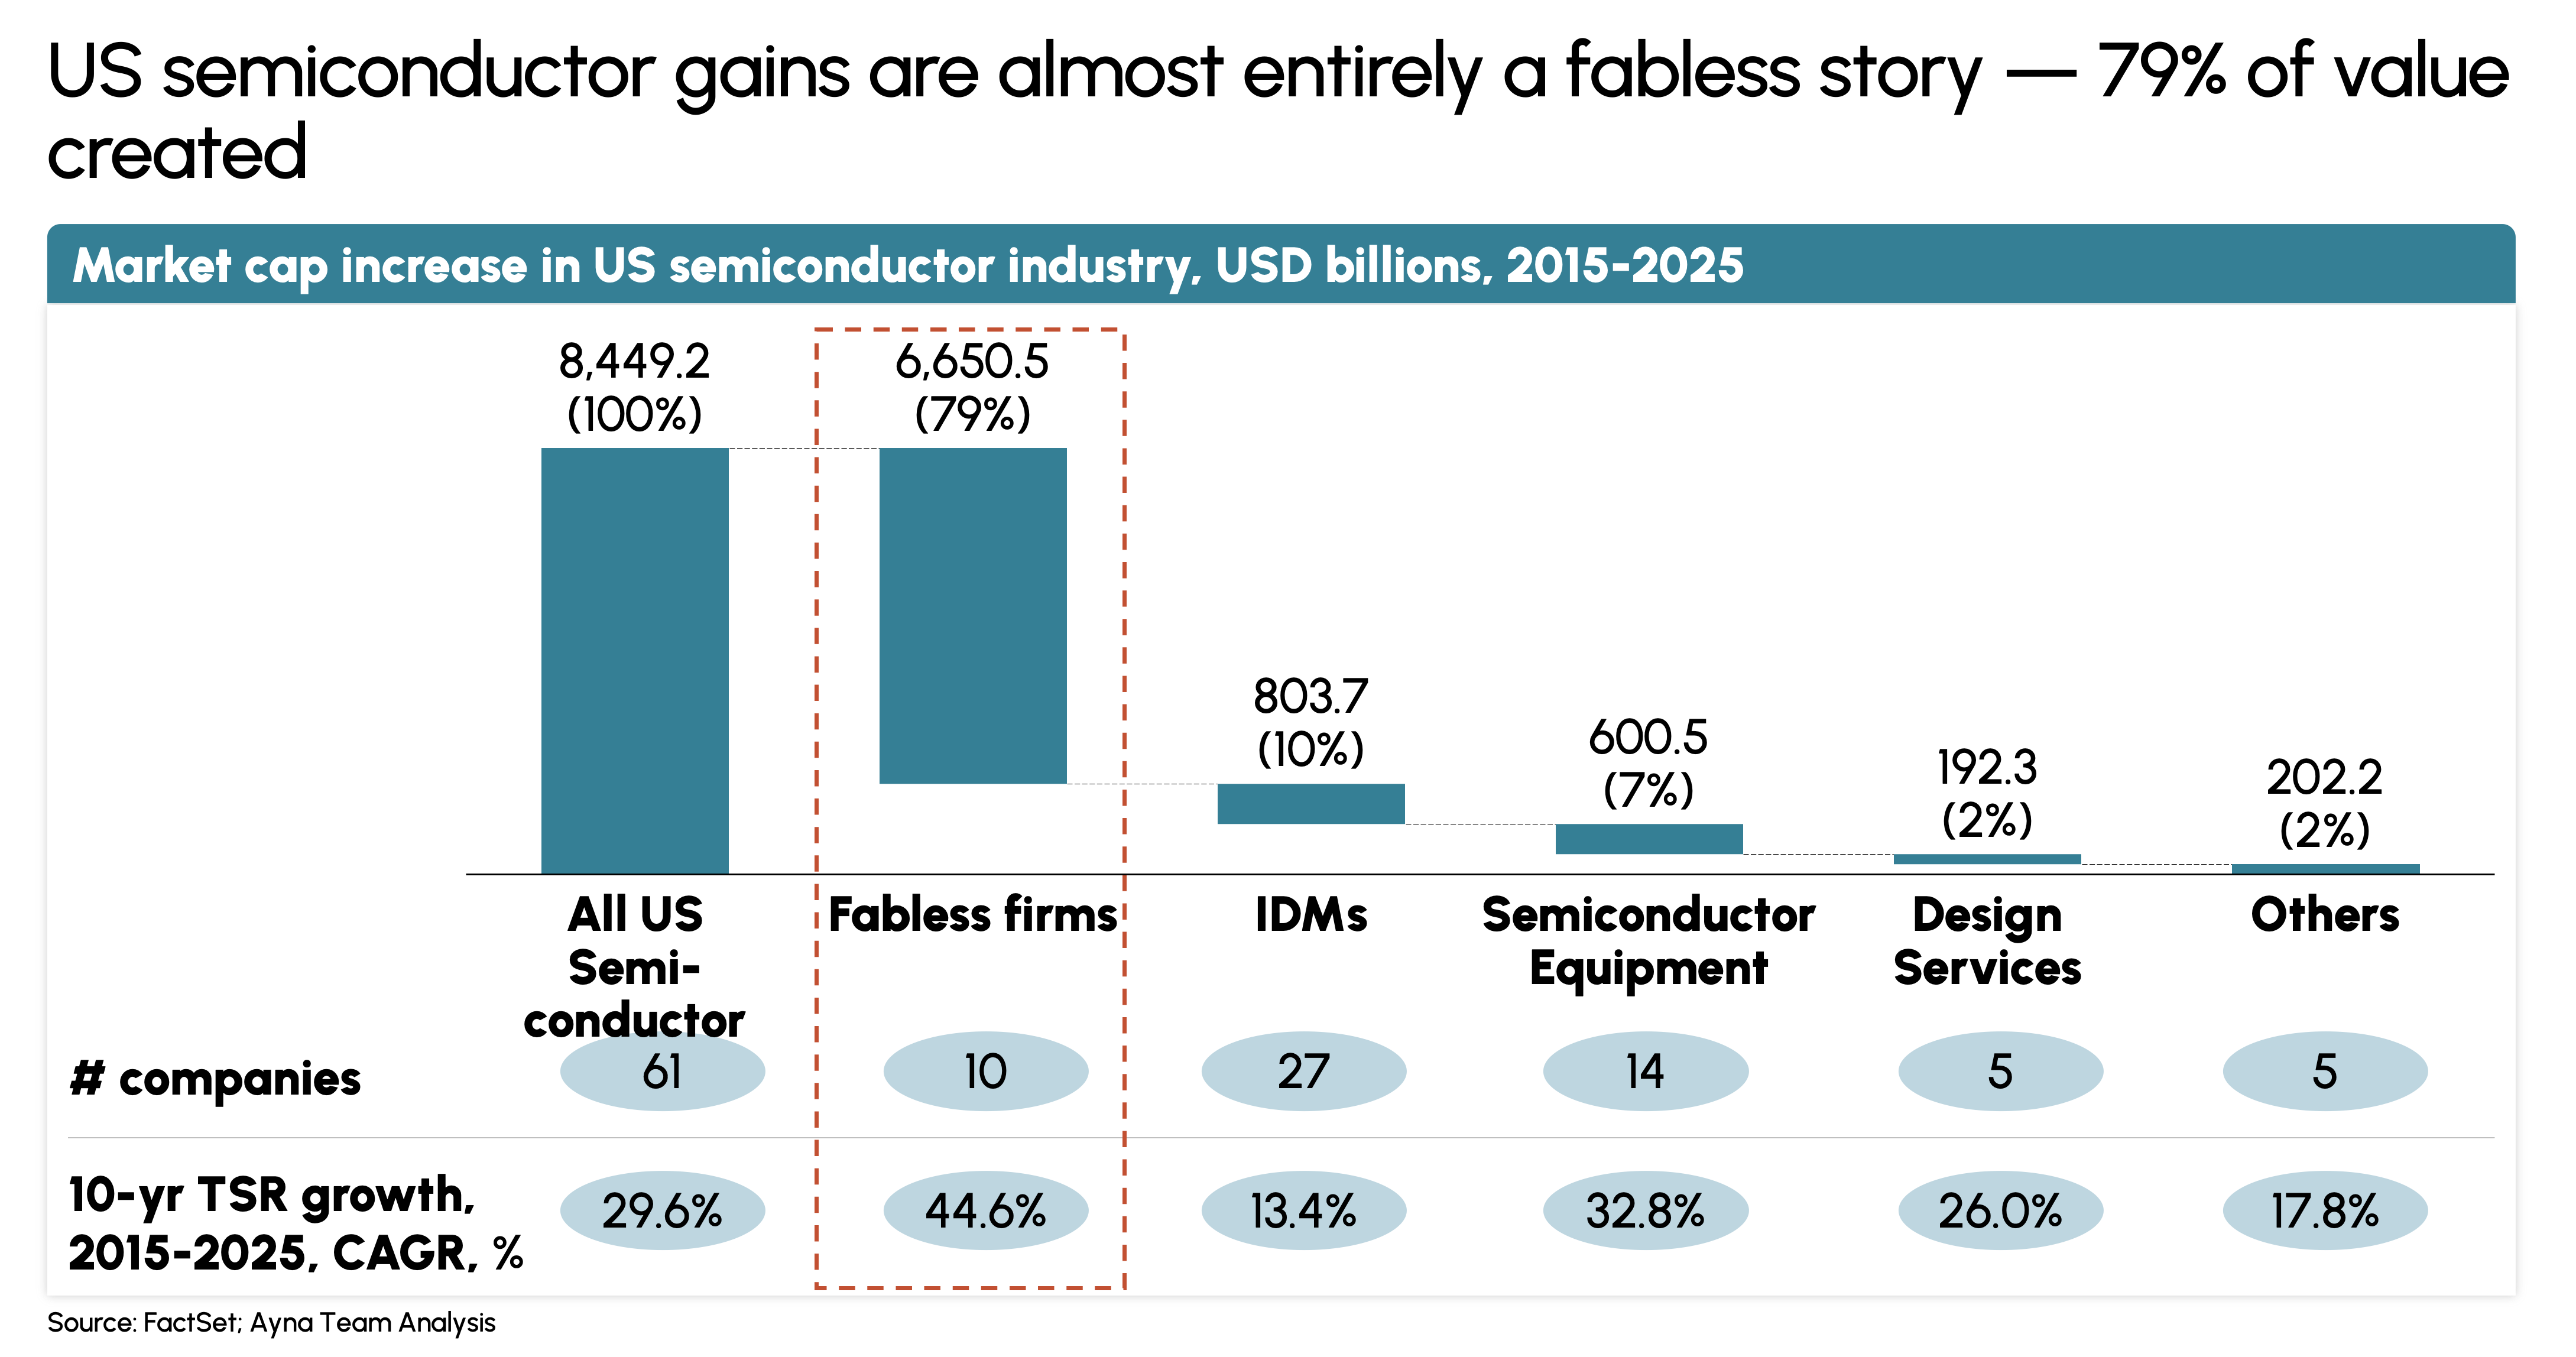
The US market has effectively chosen fabless as its winning model, rewarding firms that combine rapid architectural innovation with an asset-light structure that keeps capital free for R&D. Between 2015 and 2025, fabless firms drove 79 percent of US semiconductor market cap growth (Exhibit 4).7
Exhibit 4
The fabless model left a dependency, however. NVIDIA, AMD, and Qualcomm design the chips that power data centers, smartphones, and autonomous vehicles, but they don’t make them. TSMC in Taiwan fabricates the vast majority of leading-edge chips for US companies, with Samsung in Korea handling much of the rest. 80 to 95 percent of wafers for leading US fabless firms now come from Taiwan and Korea—NVIDIA sources over 90 percent of its wafers from TSMC, Broadcom and Qualcomm each exceed 80 percent, and AMD relies on TSMC for all wafers at 7nm or below.8
NVIDIA’s Rise Reshapes the Fabless Landscape
NVIDIA’s growth alone explains much of the fabless sector’s market cap expansion. Between 2015 and 2025, NVIDIA added $4.5 trillion in market cap, accounting for 68 percent of all US fabless market cap growth. The company delivered 72 percent total shareholder return CAGR over the decade and expanded its EV/Sales multiple by 18.6x. NVIDIA now derives roughly 88 percent of its revenue from cloud and data center infrastructure.9,10
The Cost of Fabless Success
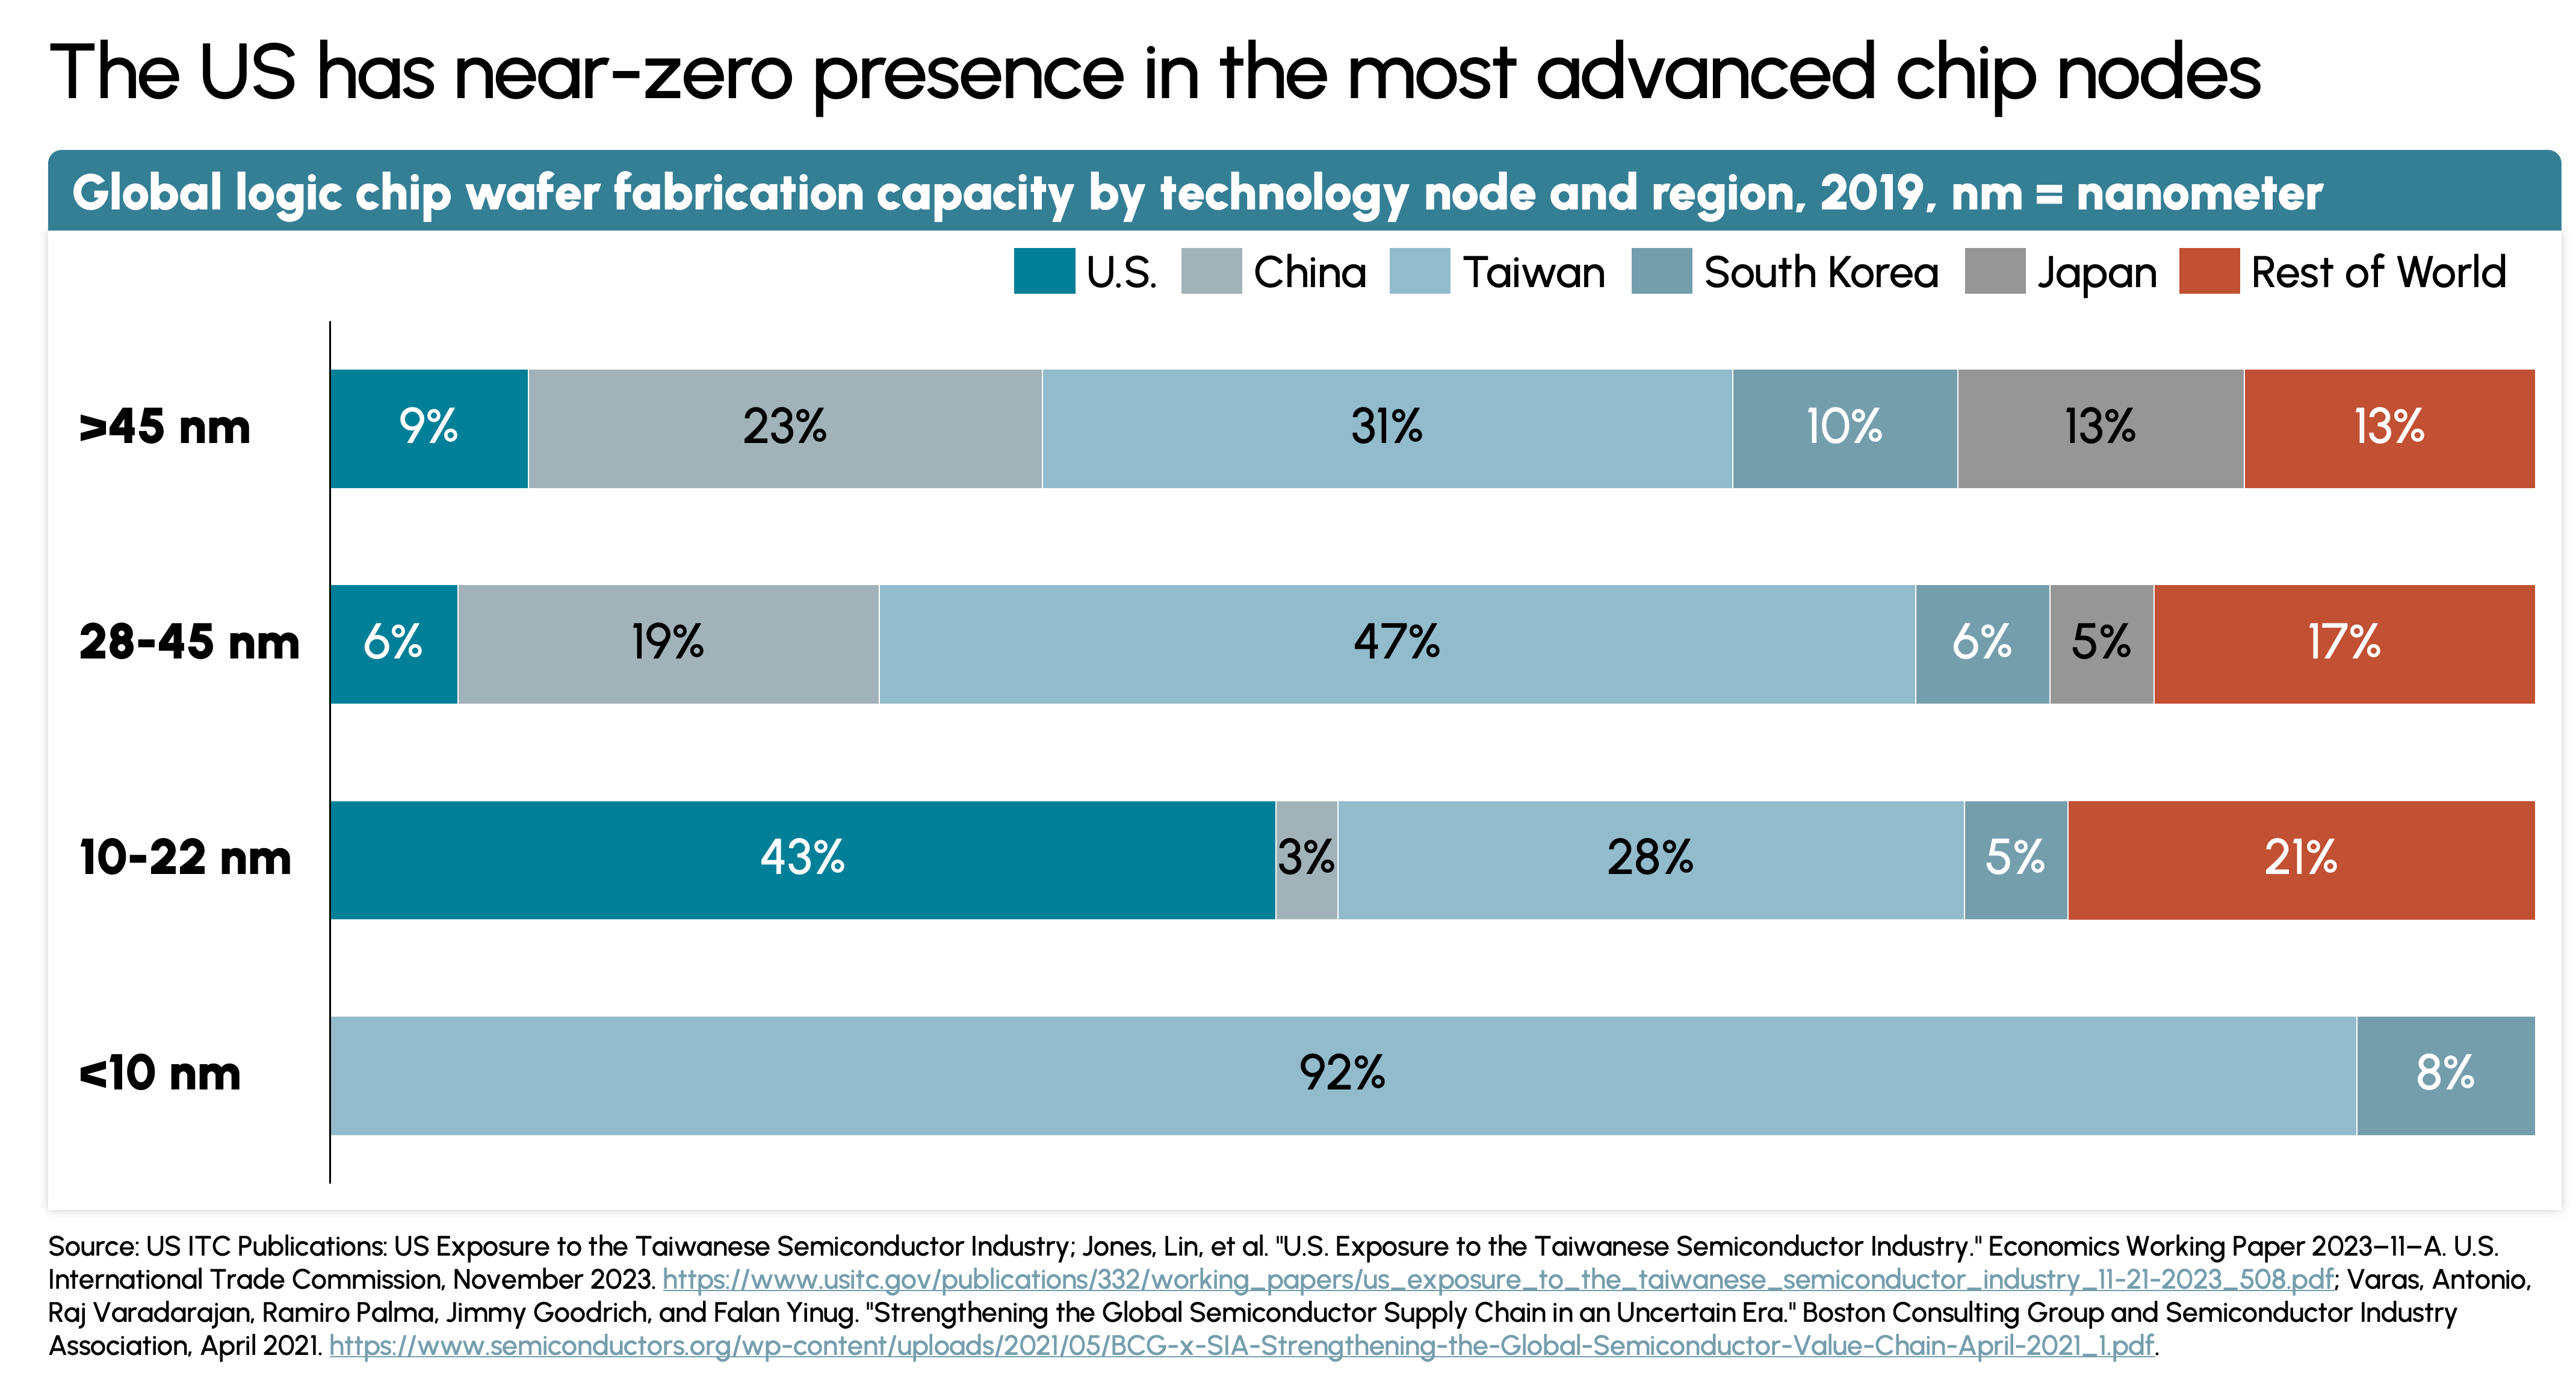
US wafer capacity has fallen from roughly 50 percent in the 1980s to less than 15 percent today. The geographic concentration extends to the most advanced process nodes (Exhibit 5). As of 2019, Taiwan controlled 92 percent of global fabrication capacity for chips under 10 nanometers. The US held less than 1 percent.
Exhibit 5
The US semiconductor trade position shifted from a $6 billion surplus in 2008 to a $30 billion deficit by 2021. The IP and architectural value stay in the US, but the physical production and the trade flows move through Asia. The industry is now entering a new era where manufacturing control is becoming as strategically important as design leadership.11
Three Growth Engines Driving Industry Expansion
With the industry on track to exceed $1.3 trillion by 2030, three distinct demand drivers will determine who captures that growth. Compute, which includes AI accelerators, GPUs, and advanced memory, will become the largest segment. Connectivity, driven by 5G infrastructure and networking chips, is projected to reach around $80 billion in the 5G semiconductor market alone by 2030. Controls, covering automotive, industrial, and edge computing applications, will reach approximately $171 billion by 2030 (Exhibit 6).12
Exhibit 6
AI Drives the Compute Boom
Compute has emerged as the industry’s dominant profit pool, and the US is well positioned to reap the rewards. The AI compute market is projected to grow from $216 billion in 2024 to $548 billion by 2030. Hyperscalers committed over $443 billion in data center capital expenditure in 2025—a 73 percent increase over 2024—pulling forward demand for GPUs, AI accelerators, advanced memory, and networking chips.13,14
5G and 6G Infrastructure Drive Connectivity Chip Demand
The 5G services market is projected to reach nearly $2 trillion by 2030, growing at roughly 60 percent CAGR. The 5G semiconductor market is expected to grow from $33.4 billion in 2025 to $79.6 billion by 2030. The 6G chipset market represents the next wave, projected to grow from $1.2 billion in 2024 to $22.8 billion by 2033.15,16,17
Autonomous Vehicles and Edge AI Fuel Controls Growth
The Controls segment is projected to reach $170.8 billion by 2030, growing at 13 percent CAGR from 2025. EVs require over 3,000 chips each to manage everything from battery optimization to autonomous navigation. Edge AI is gaining momentum as connected devices and IoT ecosystems expand.18,19
AI Concentration Defines Top Performers
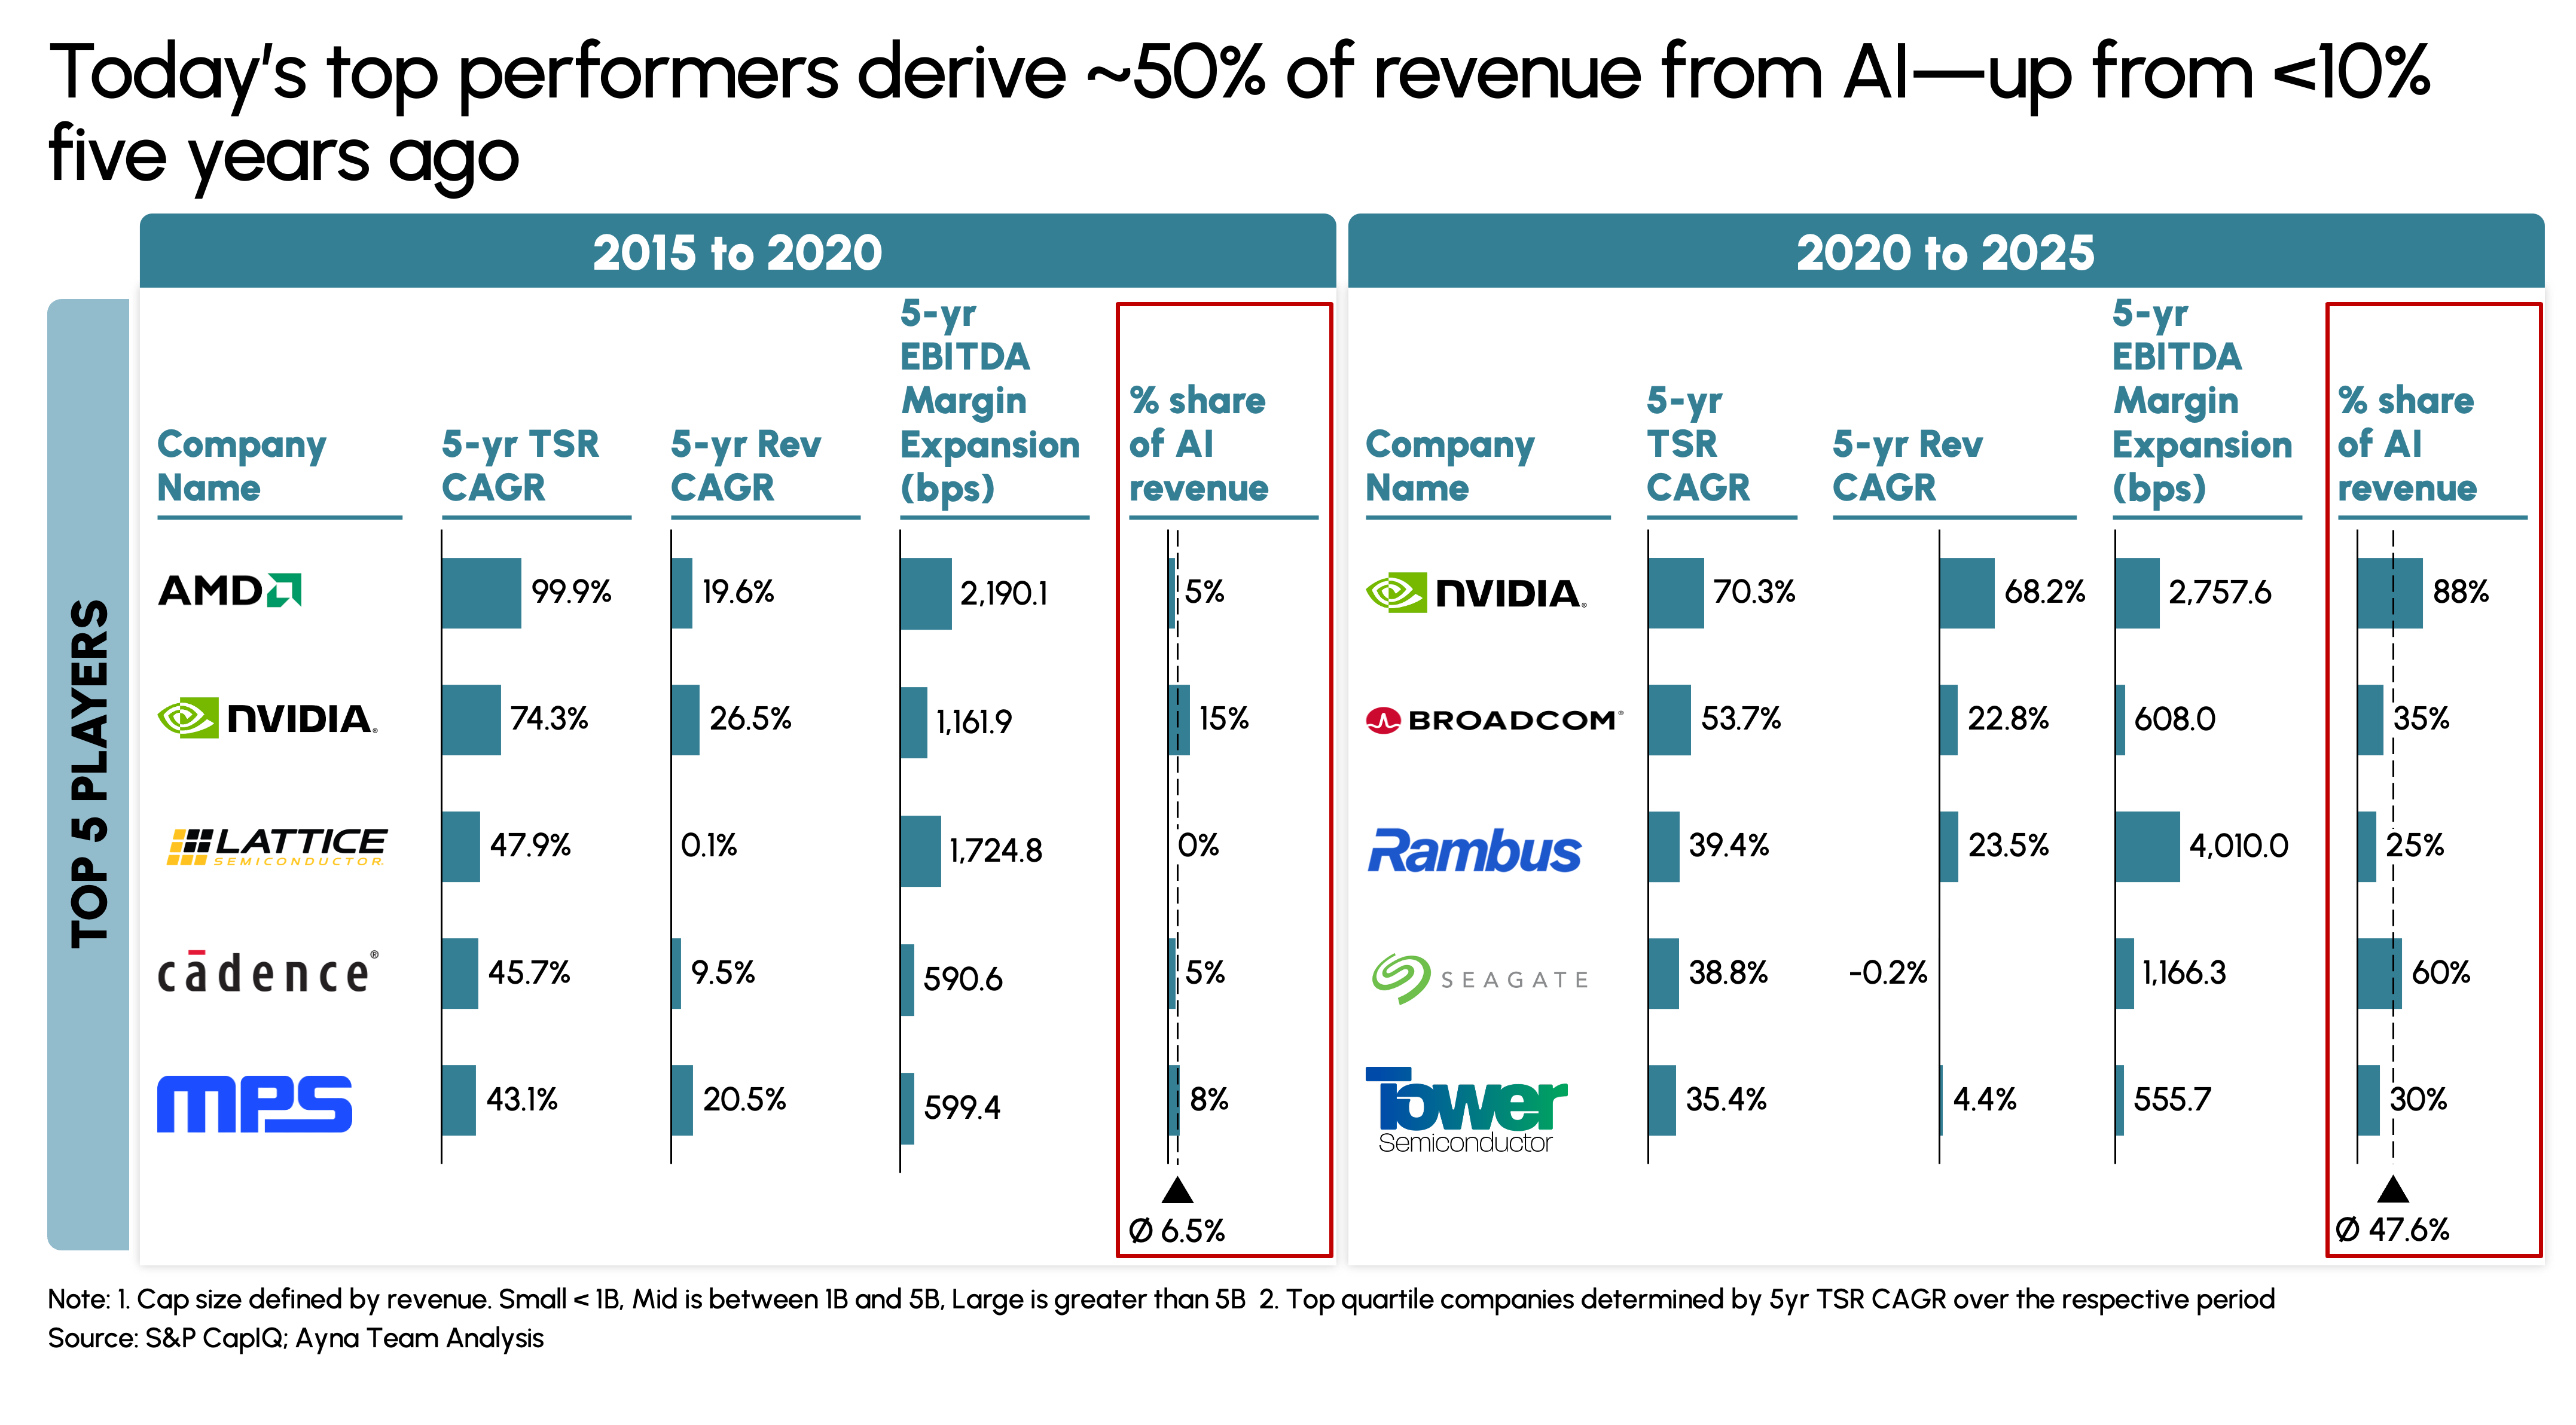
The semiconductor industry’s top performers have reshuffled around AI demand (Exhibit 7). The top five companies by shareholder returns share one thing in common: direct benefit from AI infrastructure buildout. Their average AI revenue exposure has increased from less than 10 percent to approximately 47.6 percent over five years.20
NVIDIA went from generating roughly 15 percent of revenue from AI in 2020 to nearly 88 percent by 2025. Revenue growth accelerated from 26.5 percent annually to 68.2 percent, with EBITDA margins expanding by 2,757 basis points over the same period.21
Exhibit 7
Part Two — Turning Investment into Competitive Advantage
CHIPS Act Implementation Challenges
Semiconductors are now a national priority. The US has allocated $52.7 billion through the CHIPS Act. The EU has committed €43 billion. Japan has committed over $20 billion. India has backed its Semiconductor Mission with $10 billion. Countries are competing to secure manufacturing capacity, restrict rival access, and build supply chains that can withstand geopolitical disruption.22,23
CHIPS Act Could Triple US Fabrication Capacity
The CHIPS Act has already allocated $33.7 billion in grants and up to $28.8 billion in loans. The program authorizes roughly $280 billion in new federal spending through 2027. Funded projects are expected to create 128,000 jobs, with 42,000 in manufacturing and 86,000 in construction. The projects announced between 2020 and 2025 are projected to increase capacity by 203 percent by 2032, compared to just 11 percent growth in the entire preceding decade.24,25,26
The largest projects focus on leading-edge fabrication and advanced memory:
- TSMC: Three new fabs in Phoenix, AZ. $6.6 billion in grants, $65 billion total project. Leading-edge production.
- Samsung: Two logic fabs and one R&D fab in Taylor, TX. $6.48 billion in grants, $45 billion total project.
- Micron: Four new fabs in Clay, NY. $4.6 billion in incentives, $100 billion total project. Leading-edge DRAM.
- Intel: Three projects across Chandler AZ, New Albany OH, and Hillsboro OR. $7.3 billion in grants, $96 billion total project.
However, five key risks can threaten the CHIPS-driven buildout.
Risk A: The AI Bubble—Valuations Have Surged on Record Capital Inflows
AI valuations have lost touch with revenue fundamentals. Capital inflows surged since 2021, accelerating after ChatGPT’s launch. The first half of 2025 saw $110 billion in capital raised, with no signs of slowing. A small group of AI companies occupies multiple roles simultaneously—acting as investors, customers, and strategic partners to each other—creating circular financing dynamics. Estimated ROIC on AI-based CapEx over the next five years ranges from 11.3 percent in a conservative scenario to 16.5 percent in an aggressive case, well short of the 20 to 30 percent ROICs software businesses delivered historically.27,28,29
Risk B: Tariffs—Trade Policy Creating Cost and Supply Chain Pressures
US effective tariff rates climbed throughout 2025, reaching 18 percent by late in the year after spiking to nearly 28 percent in May. The administration has proposed 25 to 100 percent tariffs on imported semiconductors. Electronic and optoelectronic goods are up 12.2 percent year-to-date. China supplies over 70 percent of rare earth minerals essential for chip manufacturing, meaning tariffs on finished chips do little to fix this upstream dependency.30,31,32,33
Risk C: The Fabrication Talent Gap
The semiconductor industry will need over 1.4 million additional skilled workers worldwide by 2030. The US is projected to create 3.85 million job openings in computer science, engineering, and technical roles by 2030, but only 2.45 million of those positions are expected to be filled. One-third of US semiconductor employees were aged 55 or over in 2023, and many will retire before new fabs come online.34,35
Risk D: Ultra-Pure Water and Materials Constraints
An average fab uses 10 million gallons of ultra-pure water each day. Semiconductor water demand is projected to double by 2035. The US also lacks primary production capacity for key raw materials: China dominates global production of gallium, germanium, fluorspar, and arsenic—all essential for advanced chip fabrication.
Risk E: Production Ramp-Up Adds Months to Fab Timelines
New fabs require roughly 42 weeks from construction completion to full-scale chip sales: 24 weeks for yield and volume ramp-up, 12 weeks production cycle time, and 6 weeks for assembly, test, and packaging. CHIPS Act fabs scheduled to come online between 2028 and 2032 will see actual chip production lag by nearly a year after construction finishes.
What Comes Next: Six Critical Priorities
The following six priorities form a framework for sustained US semiconductor leadership, organized across three stakeholder groups. Together they are designed to move the US toward vertical integration across the value chain, pairing its innovation dominance with the domestic manufacturing capacity required to strengthen and sustain it.
Operators and Firms
Fortify the Core: The firms that dominate today got there by reinvesting each cycle’s returns into the next architectural advantage. AI demand has been strong enough that organic growth has masked the need for deliberate expansion into adjacencies. The firms that will hold their position are those that used the AI boom to extend their moats rather than simply ride them—through targeted M&A and purpose-led R&D into high-growth, hyperscaler AI workloads.
Strengthen Supply Chain: Firms that control more of their own supply chain gain pricing power, faster iteration cycles, and resilience that competitors dependent on shared Asian foundry capacity cannot match. Treating manufacturing geography as a strategic variable rather than a procurement decision will become a source of competitive advantage as geopolitical pressure makes reliable supply increasingly scarce.
Investors
Back Category Leaders: The firms with the deepest moats in the most critical segments capture returns disproportionate to their size. The most durable strategy is to hold firms that own the infrastructure layer of the AI economy—including design tools, IP, and connectivity chips—because those positions compound regardless of which AI application ultimately wins.
Look Beyond AI Compute: Every major semiconductor growth cycle has rewarded capital that moved early, before the architectural winners became obvious. That opportunity is now open in 6G (72.6% CAGR), silicon photonics (29.3% CAGR), SiC and GaN power electronics (30.1% CAGR), and quantum computing (34.6% CAGR). US firms and investors are well positioned to lead each.
Policymakers
Infrastructure and Materials Transformation The CHIPS Act addressed the most visible gap in the US semiconductor stack. The less visible gaps are upstream. True vertical integration requires treating the full input chain as strategic infrastructure, as demonstrated by Amkor’s $7 billion Arizona advanced packaging facility and TSMC’s $65 billion commitment to three leading-edge fabs in Phoenix.
Government–Industry Partnership The CHIPS Act proved that federal investment could unlock private capital and shift the trajectory of domestic capacity. The next step is sustaining and sharpening that model: a co-investment framework where government and industry share both the risk and the accountability for outcomes—measured in chips produced, engineers trained, and supply chain dependencies reduced. The Advanced Manufacturing Investment Credit offering 25 to 35 percent tax credits for fab equipment is a step in this direction.
From Dominance to Resilience: What’s Required to Maintain the Edge
The fabless model delivered extraordinary value for the US over the past decade, positioning American firms at the center of the AI revolution and generating market cap growth that no other country matched. That foundation is real, and it is the starting point for what comes next.
The industry is now entering an era where manufacturing control is as strategically important as design leadership. The US recognizes this. The CHIPS Act has mobilized hundreds of billions in public and private capital. Projects are underway to triple domestic fabrication capacity by 2032. Firms are regionalizing supply chains, deepening moats through targeted M&A, and moving into the emerging segments where the next wave of value will be created.
The US has the capability to lead the next era of the semiconductor industry, built on a decades-long lead in chip design, IP, and the software ecosystems that lock in developers and compound across cycles. The question that remains is whether the US can execute to pair that strength with the manufacturing capacity the moment demands.
Sources
[1] Kuhanathan, Ano, and Guillaume Dejean. "The New Jedi Order: Global Chip War and theSemiconductor Industry." Allianz Research, March 6, 2025.https://www.allianz.com/content/dam/onemarketing/azcom/Allianz_com/economic-research/publications/specials/en/2025/march/2025-03-06-Semiconductors.pdf;Burm, Glenn. "Semiconductor and Beyond: Global Semiconductor IndustryOutlook 2026." PwC, 2026.https://www.pwc.com/gx/en/industries/technology/pwc-semiconductor-and-beyond-2026-full-report.pdf;SEMI Membership and Engagement Report 2026.
[2] Semiconductor Industry Association. "State of the Industry Report 2025." July 2025.https://www.semiconductors.org/wp-content/uploads/2025/07/SIA-State-of-the-Industry-Report-2025.pdf;WSTS Historical Billings Report. https://www.wsts.org/67/Historical-Billings-Report;World Bank. "GDP Growth (Annual %)." World Development Indicators,2025. https://data.worldbank.org/indicator/NY.GDP.MKTP.KD.ZG.
[3] Allianz Research,March 2025; PwC 2026 Semiconductor Outlook; SEMI Membership and EngagementReport 2026.
[4] Deloitte Insights."2026 Semiconductor Industry Outlook." February 2026.https://www.deloitte.com/us/en/insights/industry/technology/technology-media-telecom-outlooks/semiconductor-industry-outlook.html.
[5] Company investor relations filings: NVIDIA Form 8-K Q4 FY25; Synopsys and Cadence annual reports. EDA leaders sustained >80% gross margins; fabless R&D rates per company filings.https://investor.nvidia.com/financial-information/annual-reports/default.aspx.
[6] S&P CapIQ; Ayna Team Analysis. Global Semiconductor market cap of public companies, 2015-2025.
[7] FactSet; Ayna Team Analysis. Market cap increase in US semiconductor industry, USD billions,2015-2025.
[8] Varadarajan, Raj, etal. "Emerging Resilience in the Semiconductor Supply Chain." BostonConsulting Group and Semiconductor Industry Association, April 2021.https://www.semiconductors.org/emerging-resilience-in-the-semiconductor-supply-chain.
[9] Varadarajan, Raj, etal. "Emerging Resilience in the Semiconductor Supply Chain." BCG andSIA, 2021.https://www.semiconductors.org/emerging-resilience-in-the-semiconductor-supply-chain.
[10] S&P CapIQ; NVIDIA investor relations. NVIDIA added $4.5 trillion in market cap between 2015 and2025; 72% TSR CAGR; 18.6x EV/Sales expansion.https://investor.nvidia.com/financial-information/annual-reports/default.aspx;Ayna Team Analysis.
[11] Kuhanathan, Ano, and Guillaume Dejean. Allianz Research, March 6, 2025; Burm, Glenn. PwC, 2026; SEMIMembership and Engagement Report 2026.
[12] BloombergIntelligence. "AI Accelerator Market Looks Set to Exceed $600 Billion by2033." January 14, 2026.https://www.bloomberg.com/company/press/ai-accelerator-market-looks-set-to-exceed-600-billion-by-2033-driven-by-hyperscaler-demand/.
[13] Grand View Research."5G Services Market Size, Share & Trends Analysis Report,2025-2030." 2025.https://www.grandviewresearch.com/industry-analysis/5g-services-market.
[14] Dell'Oro Group."Hyperscaler AI Deployments Lift Data Center CapEx to Record Highs in2025." September 16, 2025.https://www.delloro.com/news/hyperscaler-ai-deployments-lift-data-center-capex-to-record-highs-in-2025/;ClearBridge Investments. "Gen AI Model Buildouts Spur InfrastructureBoom." 2025.https://www.clearbridge.com/perspectives/institutional/2025/gen-ai-model-buildouts-spur-infrastructure-boom.
[15] Mordor Intelligence."Autonomous Vehicles Semiconductor Market." 2025.https://www.mordorintelligence.com/industry-reports/autonomous-vehicles-semiconductor-market;Global Market Insights. "Autonomous Driving Chips Market." September2025.https://www.gminsights.com/industry-analysis/autonomous-driving-chips-market.
[16] Sharma, Raksha."6G Chipset Market Research Report 2033." Growth Market Reports.Accessed March 3, 2026.https://growthmarketreports.com/report/6g-chipset-market.
[17] Mordor Intelligence."5G Chipset Market." March 2026.https://www.mordorintelligence.com/industry-reports/5g-chipset-market.
[18] SemiconductorIndustry Association. "Americas Chip Resurgence: Over $640 Billion inSemiconductor Supply Chain Investments." Last updated January 30, 2026.https://www.semiconductors.org/chip-supply-chain-investments/; EuropeanCommission. "European Chips Act."https://commission.europa.eu/strategy-and-policy/priorities-2019-2024/europe-fit-digital-age/european-chips-act_en;India Semiconductor Mission. https://www.indiaism.in.
[19] S&P CapIQ; Ayna Team Analysis. Top semiconductor performers by 5-year TSR CAGR, 2020-2025.
[20] CongressionalResearch Service. "Frequently Asked Questions: CHIPS Act of 2022Provisions and Implementation." CRS Report R47523.https://www.congress.gov/crs-product/R47523; Young, David K., et al. "TheFuture of the CHIPS and Science Act." The Conference Board, March 13,2025.https://www.conference-board.org/research/ced-policy-backgrounders/the-future-of-the-CHIPS-and-Science-Act.
[21] SemiconductorIndustry Association. "Americas Chip Resurgence." January 30, 2026.https://www.semiconductors.org/chip-supply-chain-investments/.
[22] Crunchbase; Aventis Advisors Analysis.https://aventis-advisors.com/ai-valuation-multiples/#dealvolume; Sam, Cedric,et al. "A Guide to the Circular Deals Underpinning the AI Boom."Bloomberg, January 22, 2026. https://www.bloomberg.com/graphics/2026-ai-circular-deals/.
[23] SemiconductorIndustry Association. "America Projected to Triple SemiconductorManufacturing Capacity by 2032." May 8, 2024.https://www.semiconductors.org/america-projected-to-triple-semiconductor-manufacturing-capacity-by-2032-the-largest-rate-of-growth-in-the-world/.
[24] Gandhi, Swati."Trump Plans to Mandate 1:1 Ratio of Domestic to Imported Chips."Business Standard, September 26, 2025.https://www.business-standard.com/world-news/trump-us-chip-policy-1-1-ratio-domestic-imports-tariff-plan-125092600697_1.html;White House. "Adjusting Imports of Semiconductors." January 2026.https://www.whitehouse.gov/presidential-actions/2026/01/adjusting-imports-of-semiconductors-semiconductor-manufacturing-equipment-and-derivative-products/.
[25] Budget Lab at Yale."State of US Tariffs." October 30, 2025.https://budgetlab.yale.edu/research/state-us-tariffs-october-30-2025.
[26] S&P CapIQ; Ayna Team Analysis. Estimated hyperscaler ROIC on AI-based CapEx over five years,conservative and aggressive scenarios.
[27] IDTechEx. "WaterUsage in Semiconductor Manufacturing to Double by 2035."https://www.idtechex.com/en/research-article/water-usage-in-semiconductor-manufacturing-to-double-by-2035/32746;World Economic Forum. "The Water Challenge for SemiconductorManufacturing." July 2024.https://www.weforum.org/stories/2024/07/the-water-challenge-for-semiconductor-manufacturing-and-big-tech-what-needs-to-happen/.
[28] SemiconductorIndustry Association. "State of the Industry Report 2025." July 2025.https://www.semiconductors.org/wp-content/uploads/2025/07/SIA-State-of-the-Industry-Report-2025.pdf.
[29] U.S. GeologicalSurvey. Mineral Commodity Summaries 2024. Reston, VA: USGS, January 31, 2024.https://doi.org/10.3133/mcs2024.
[30] MarketsandMarkets."Silicon Photonics Market." 2025.https://www.marketsandmarkets.com/Market-Reports/silicon-photonics-market-81758773.html.
[31] Mordor Intelligence."SiC and GaN Power Electronics Market." 2025.https://www.mordorintelligence.com/industry-reports/silicon-carbide-and-gallium-nitride-market.
[32] Sharma, Raksha."6G Chipset Market Research Report 2033." Growth Market Reports.Accessed March 3, 2026.https://growthmarketreports.com/report/6g-chipset-market.
[33] SemiconductorIndustry Association. "Chipmakers Are Ramping Up Production to AddressSemiconductor Shortage." February 26, 2021.https://www.semiconductors.org/chipmakers-are-ramping-up-production-to-address-semiconductor-shortage-heres-why-that-takes-time/.
[34] SemiconductorIndustry Association. "Americas Chip Resurgence." January 30, 2026.https://www.semiconductors.org/chip-supply-chain-investments/; TSMC Arizona.https://www.tsmc.com/english/dedicatedFoundry/technology/arizona.
[35] MarketsandMarkets /Mordor Intelligence. Quantum Computing Chips Market, 2025-2026; Ayna TeamAnalysis.