
Listen Now
Introduction
The industrial sector in 2025 is navigating a structurally more difficult operating environment. A 14% cumulative increase in Consumer Price Index (CPI) since 2022, borrowing costs that have quadrupled from pre-Covid norms, and a sharp reset in effective tariff rate to ~14.8% have fundamentally altered the cost structure of the sector.
Despite these pressures, the sector has demonstrated resilience. Revenue growth has slowed but remained positive, rising from $3,157 billion to $3360 billion between 2022 and 2025 (2.1% CAGR). At the same time, 58% of companies have maintained or expanded margins, with median gross margins increasing by ~100 basis points.
However, the market has begun to treat growth as a scarce and high-value commodity. Top-quartile growers delivered ~37.2% TSR, outperforming the bottom quartile by 35 points and trading at nearly 2x the valuation multiples. This report examines the pressures shaping the sector, the playbook for margin preservation, and the widening gap between leaders and laggards.
The Perfect Storm of Macroeconomic Headwinds
The primary challenge for industrials in 2025 is a convergence of rising costs and stagnant production (Exhibit 1).
Following the pandemic, the era of predictable inflation and cheap capital has ended. Inflation remains structurally elevated, driven by supply chain disruptions and volatile input costs. At the same time, borrowing costs have risen sharply, increasing the cost of capital and constraining investment.
Exhibit 1: Macro-economic Headwinds for the Industrial Sector
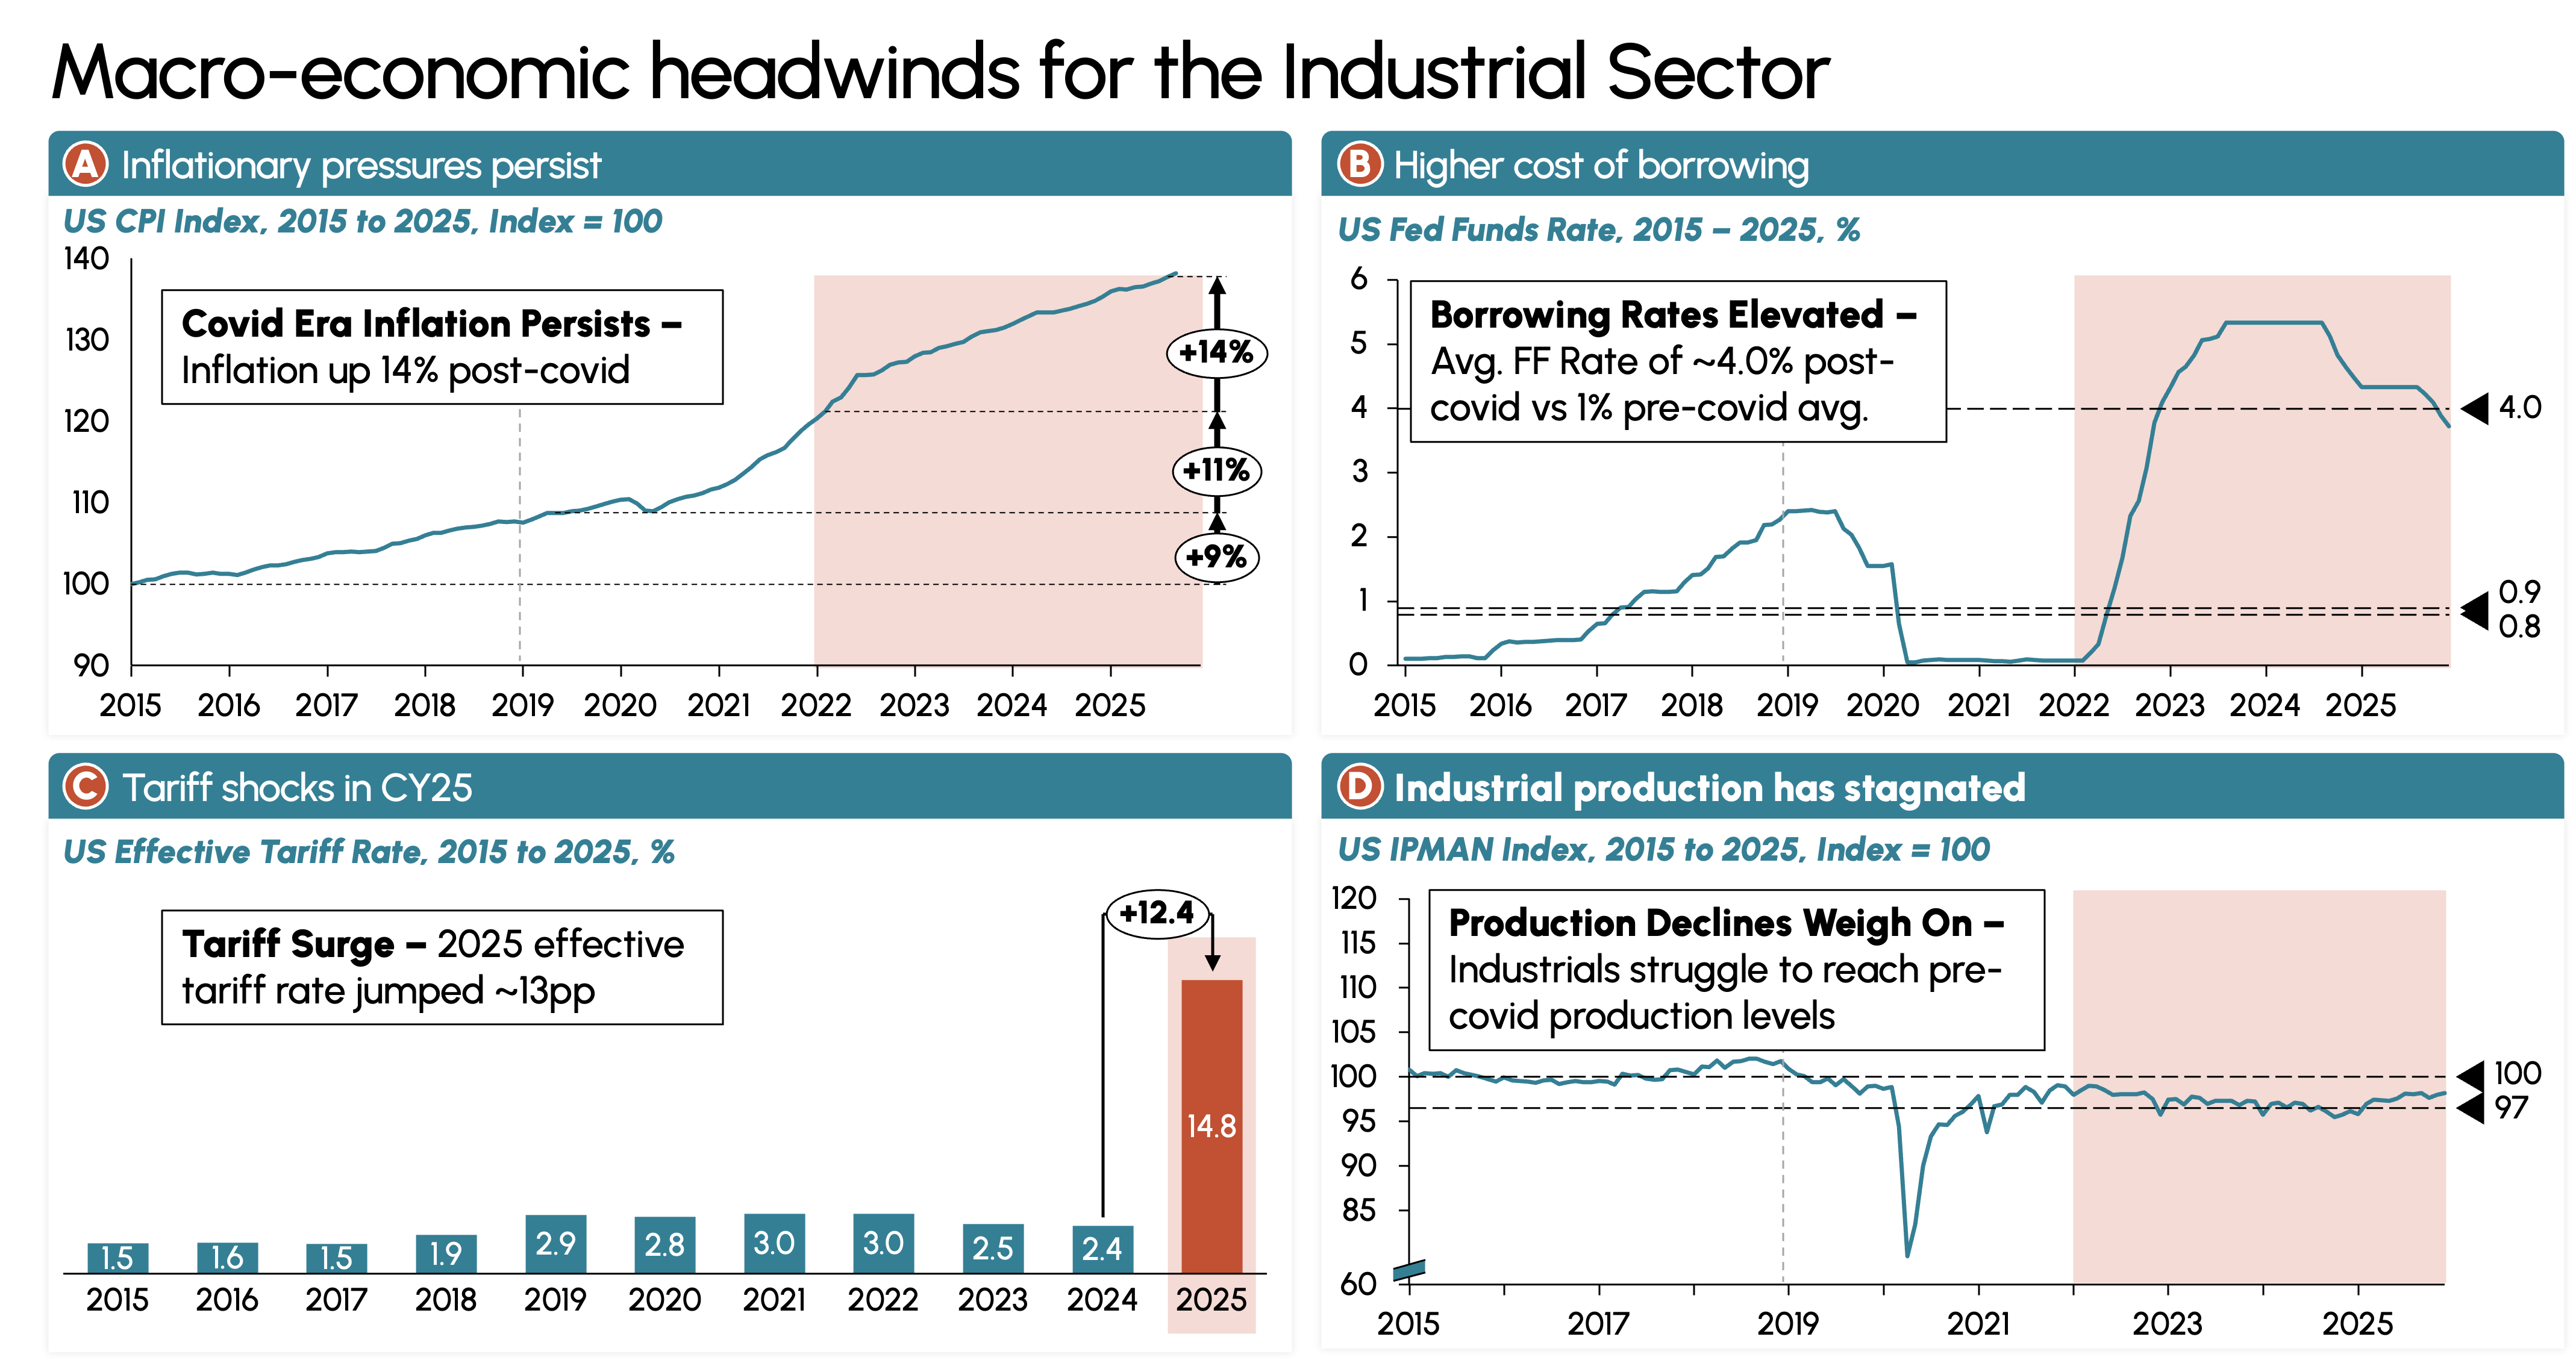
Tariffs have further compounded the challenge. After years of relative stability, the effective tariff rate surged to ~14.8% in 2025, nearly a 13-fold increase over historical averages. Beyond the magnitude of the increase, the pace and unpredictability of policy changes – introductions, pauses, and escalations have made planning significantly more difficult. Industrial companies are now operating in an environment where sourcing decisions, supplier contracts, and capital allocation must be made under heightened uncertainty.
The cumulative effect is a structurally more volatile operating environment one where cost visibility is reduced and decision-making cycles are compressed.
Responding to Pressure: Sector Resilience and Margin Preservation
Despite this hostile economic climate, the sector has not buckled. Instead, it has demonstrated a strong capacity for active management and margin preservation. Revenue growth slowed to a 2.1% CAGR between 2022 and 2025, down from pre-Covid levels but remained positive. At the same time, median gross margins expanded from 27.8% to 28.8% (Exhibit 2).
Exhibit 2: Revenue Growth and Margin Preservation (2015–2025)
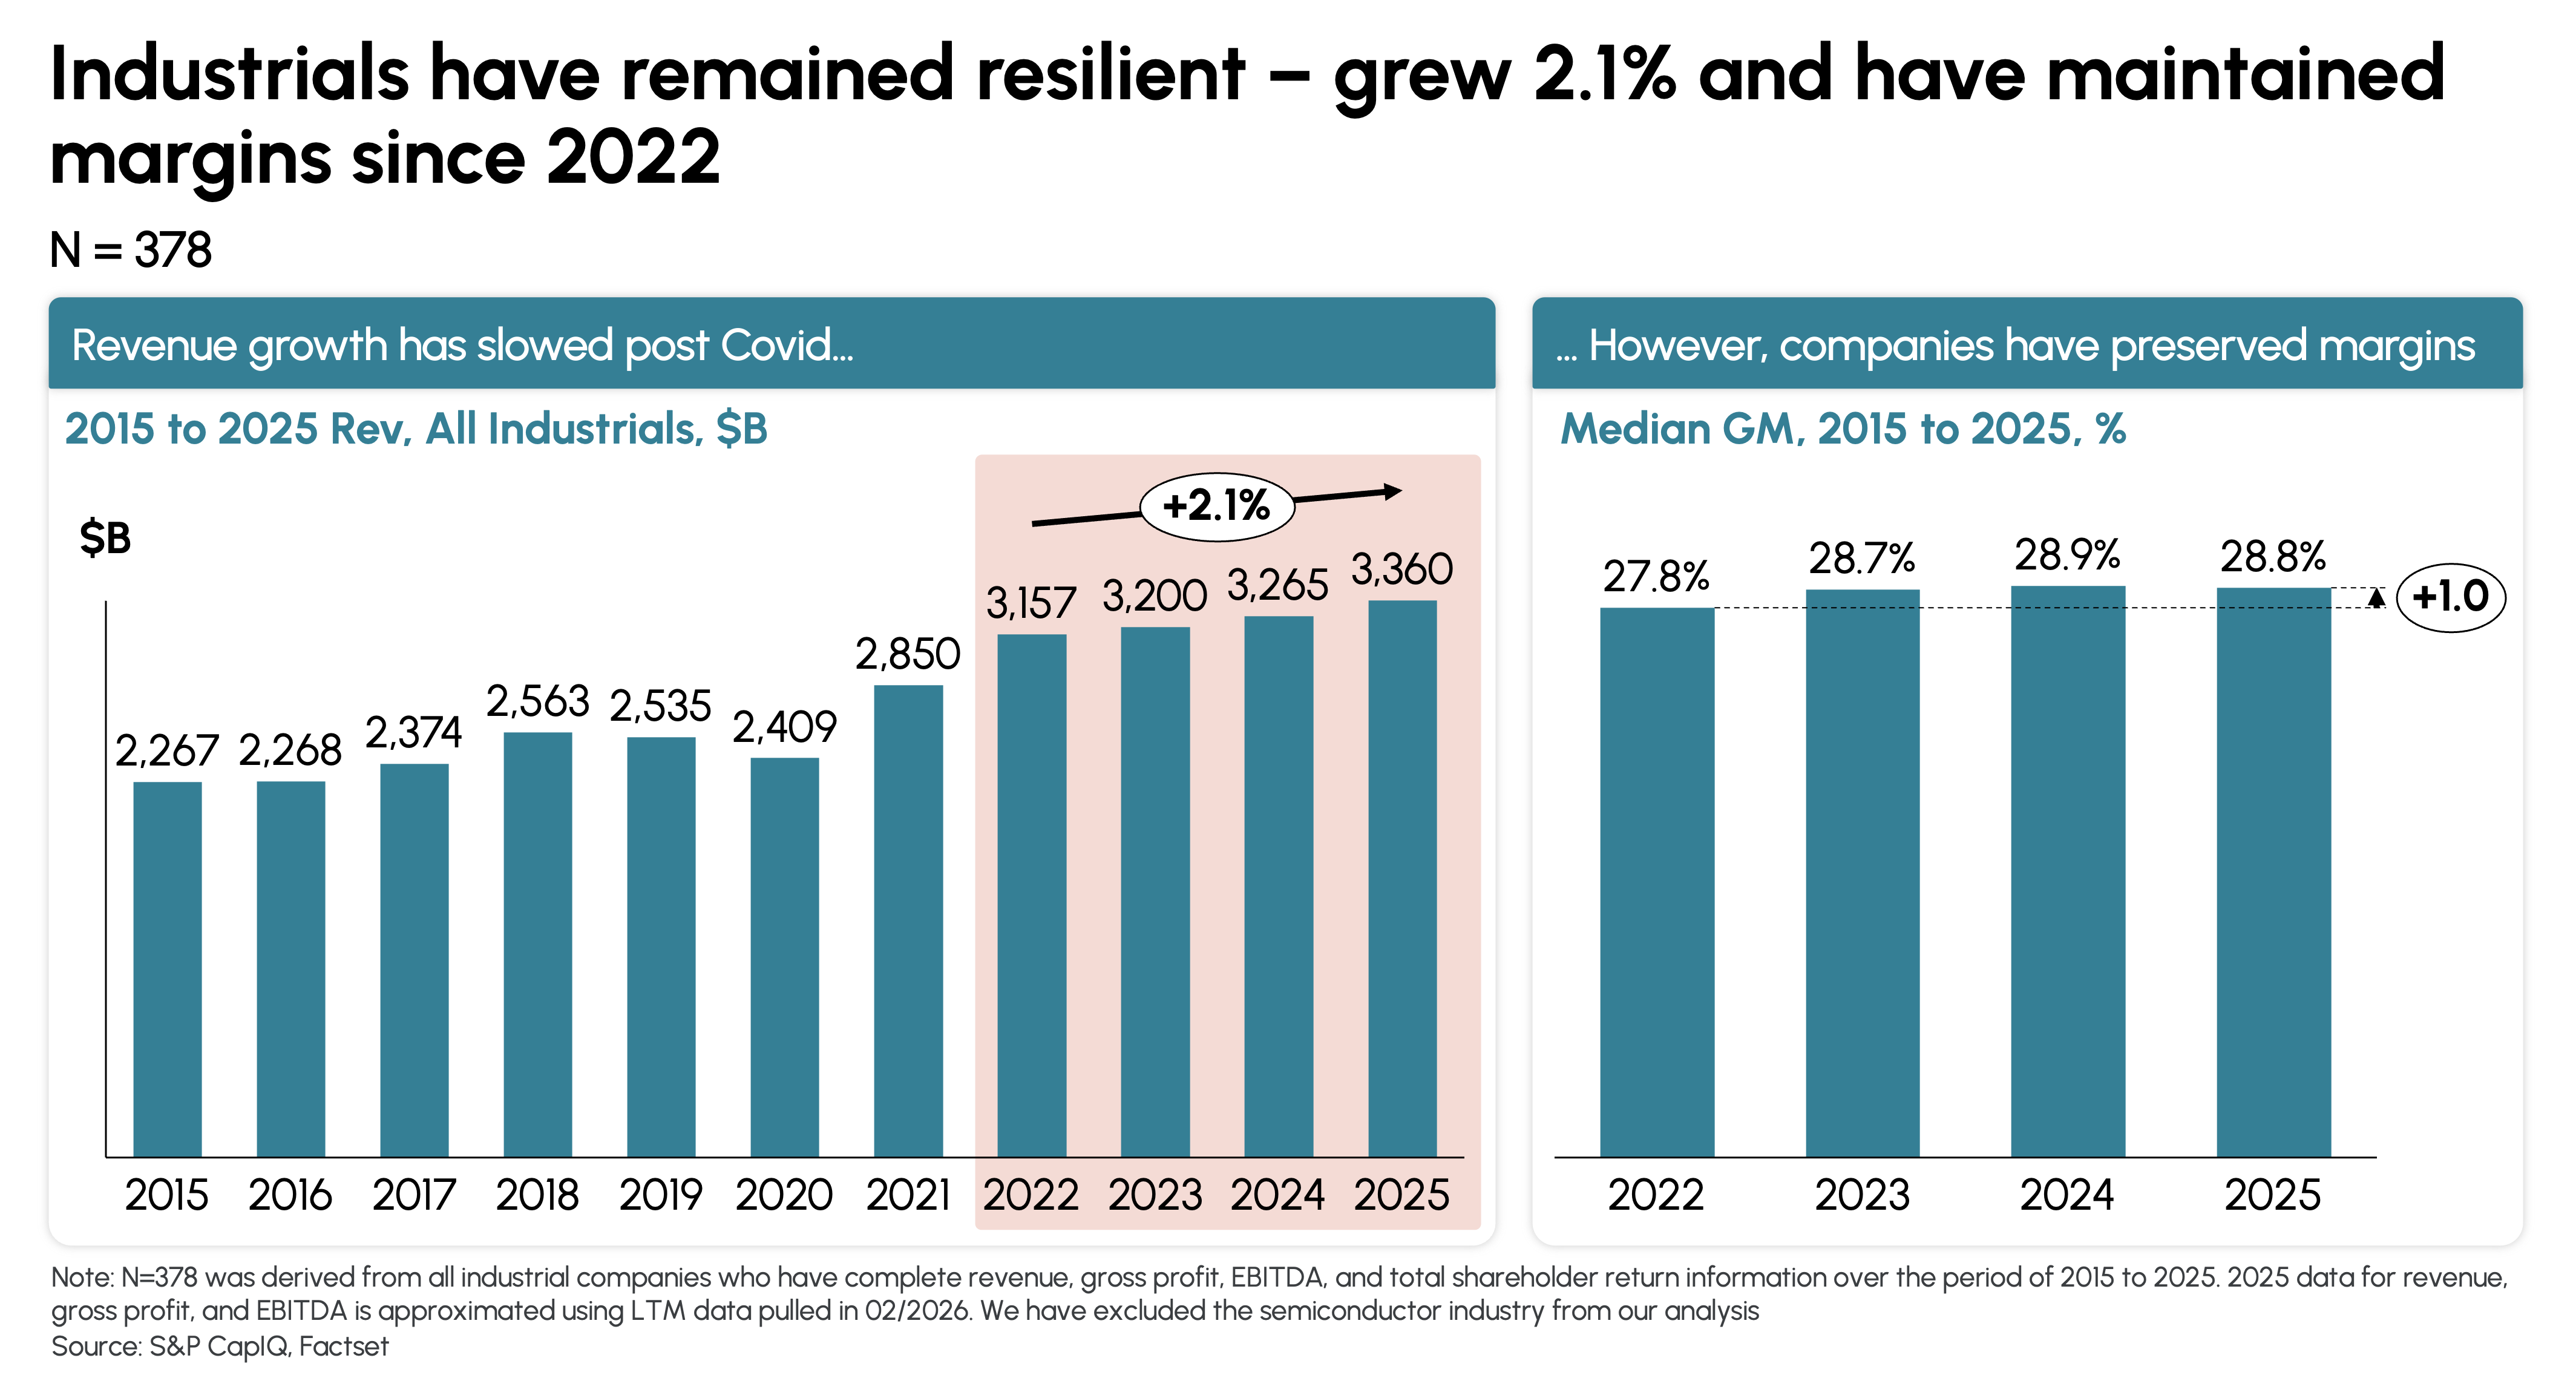
This performance reflects a shift in how industrial companies operate. Pricing discipline has become a necessity rather than a competitive advantage, and cost management has become more proactive and continuous.
Performance, however, has not been uniform across segments. Sectors such as aerospace & defense, electrical, energy, electronics, and construction have benefited from secular tailwinds including increased investment in data center infrastructure and higher defense spending allowing them to grow topline while expanding margins. In contrast, sectors such as industrial materials, metals & mining, and automotive manufacturing have experienced margin pressure due to input cost volatility and demand normalization. The data suggests that while resiliency has been broadly demonstrated, sustaining it in a low-growth environment requires continued agility in responding to cost fluctuations.
The Growth Premium: The Widening Gap in Shareholder Value
As organic growth becomes harder to find, the market is placing an increasing premium on companies that can deliver it. The gap between top-quartile and bottom-quartile performers has widened significantly (Exhibit 3).
Exhibit 3: Growth Quartile Performance – Revenue CAGR, TSR, and EV/EBITDA
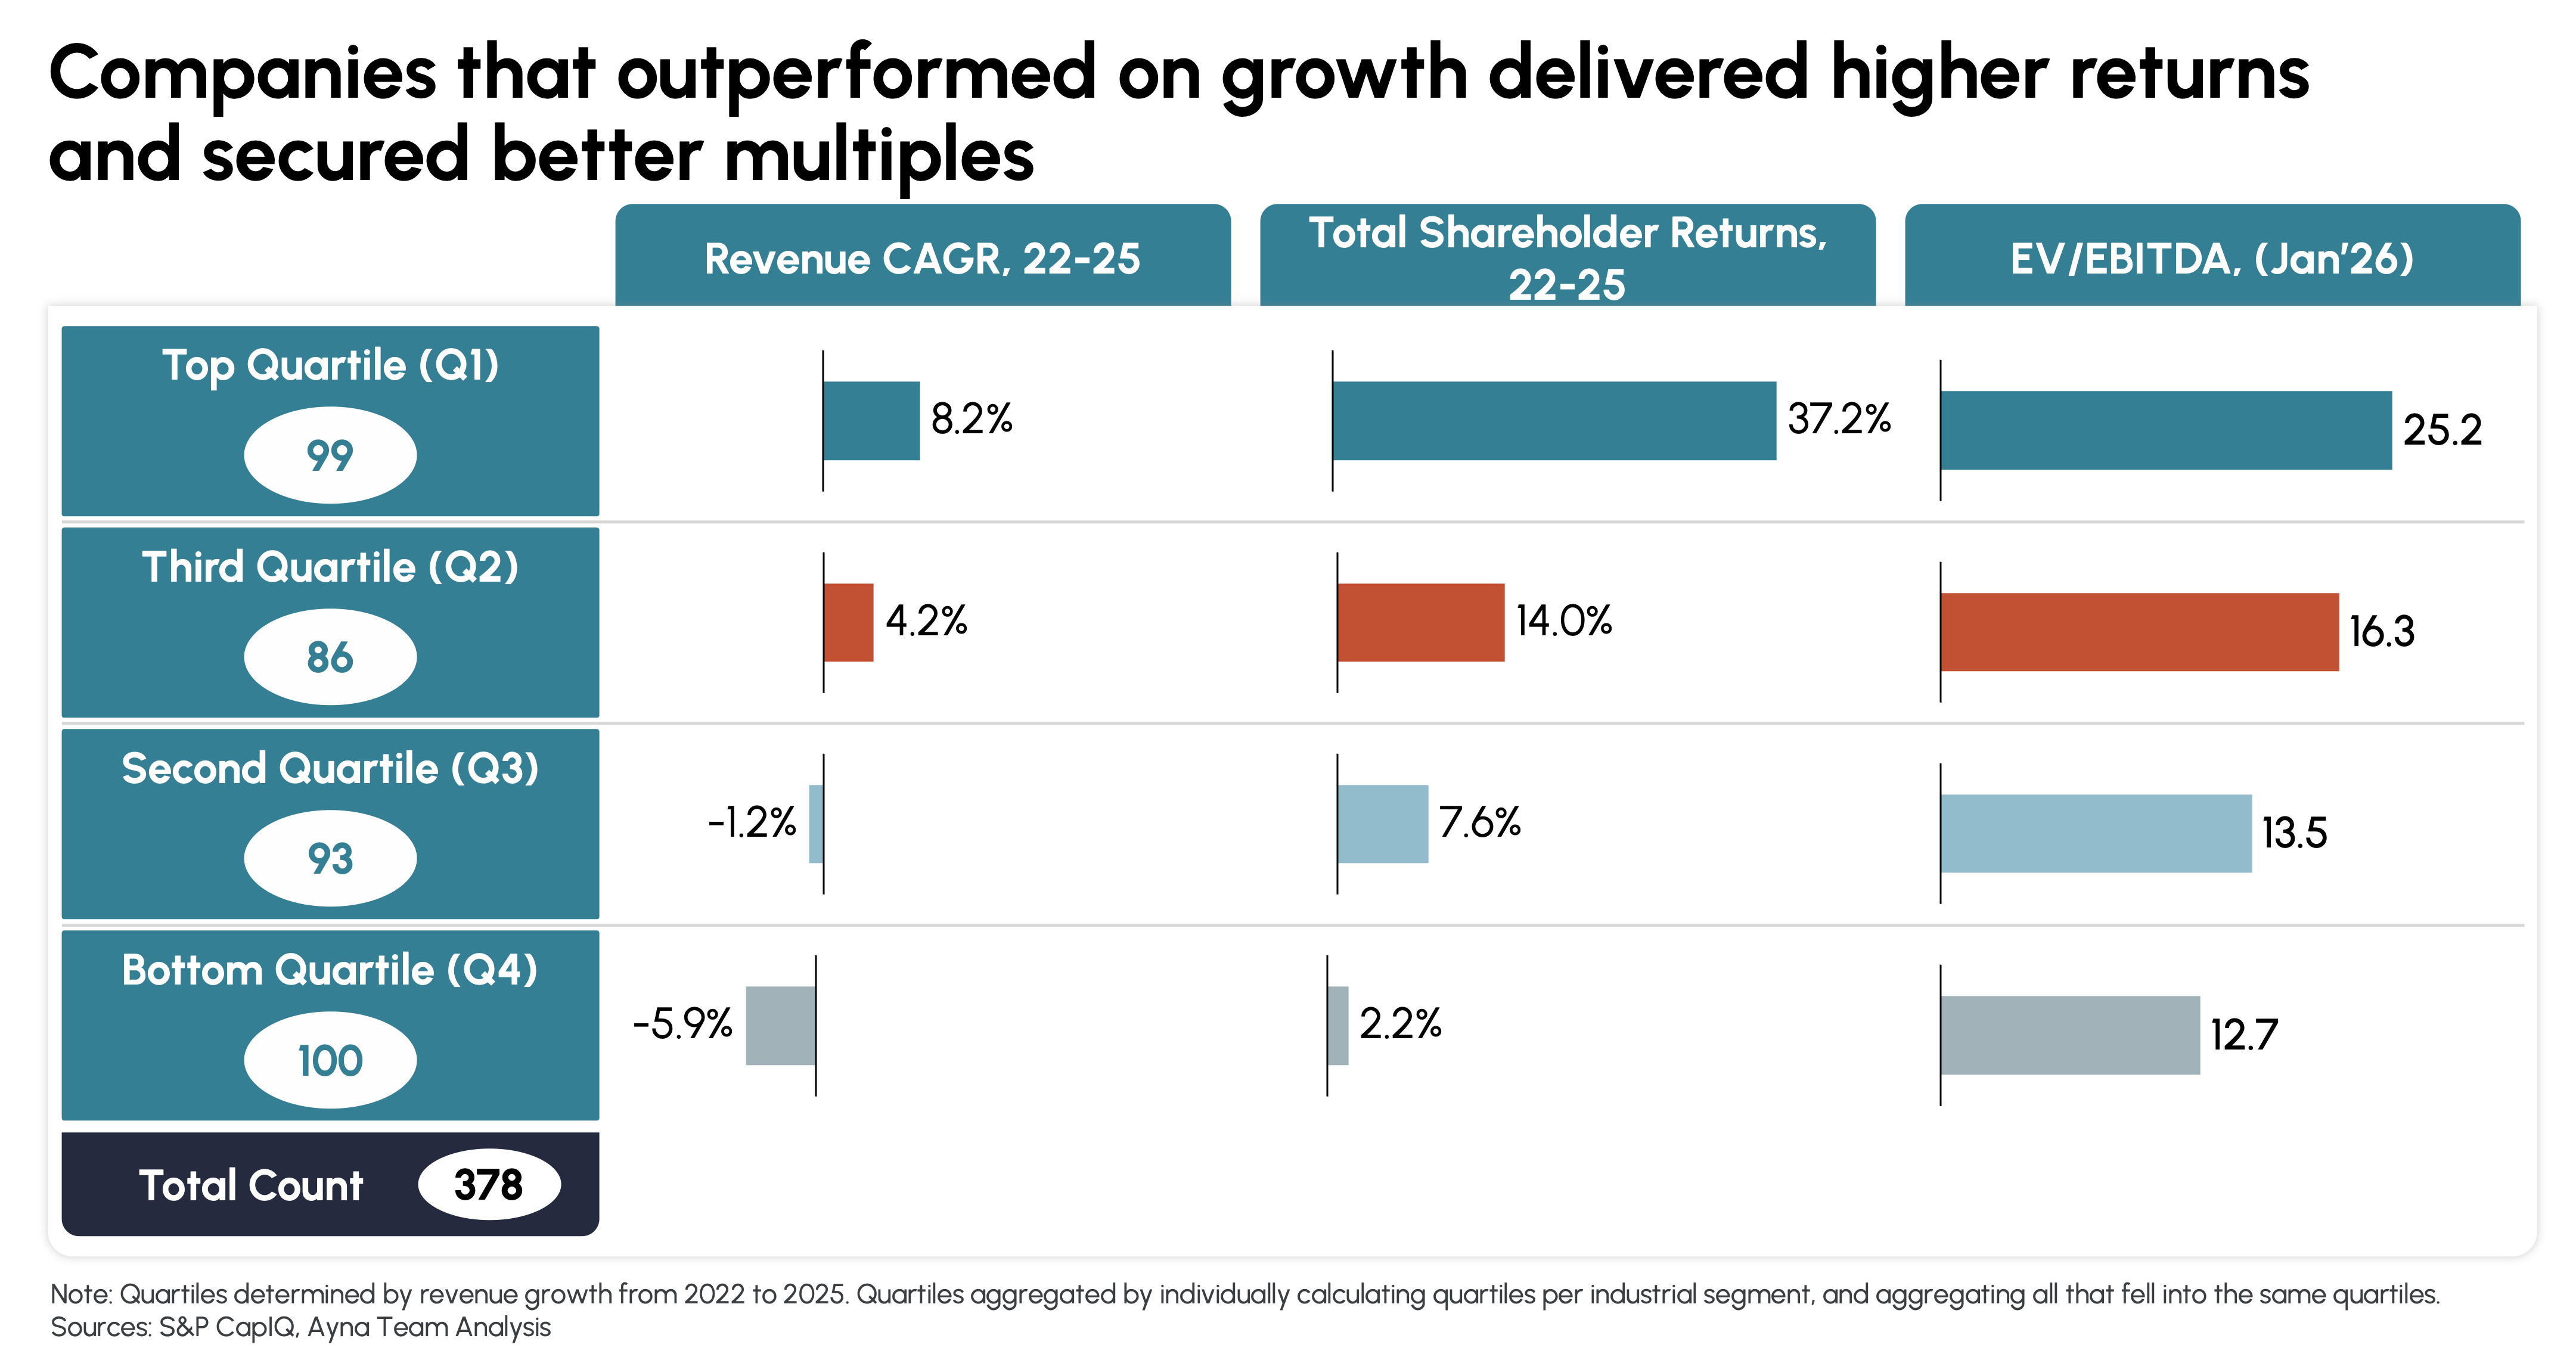
Top-quartile growers delivered ~37.2% TSR between 2022 and 2025, compared to just ~2.2% for bottom-quartile companies—a gap of 35 percentage points. At the same time, valuation multiples reflect this divergence, with top performers trading at ~25.2x EV/EBITDA versus ~12.7x for the bottom quartile. This indicates a fundamental shift in market behavior. Stability alone is no longer rewarded – growth is increasingly the primary driver of valuation. This divergence is visible even within individual segments (Exhibit 4).
Exhibit 4: Segment-Level Growth Premium – Revenue CAGR and TSR by Quartile
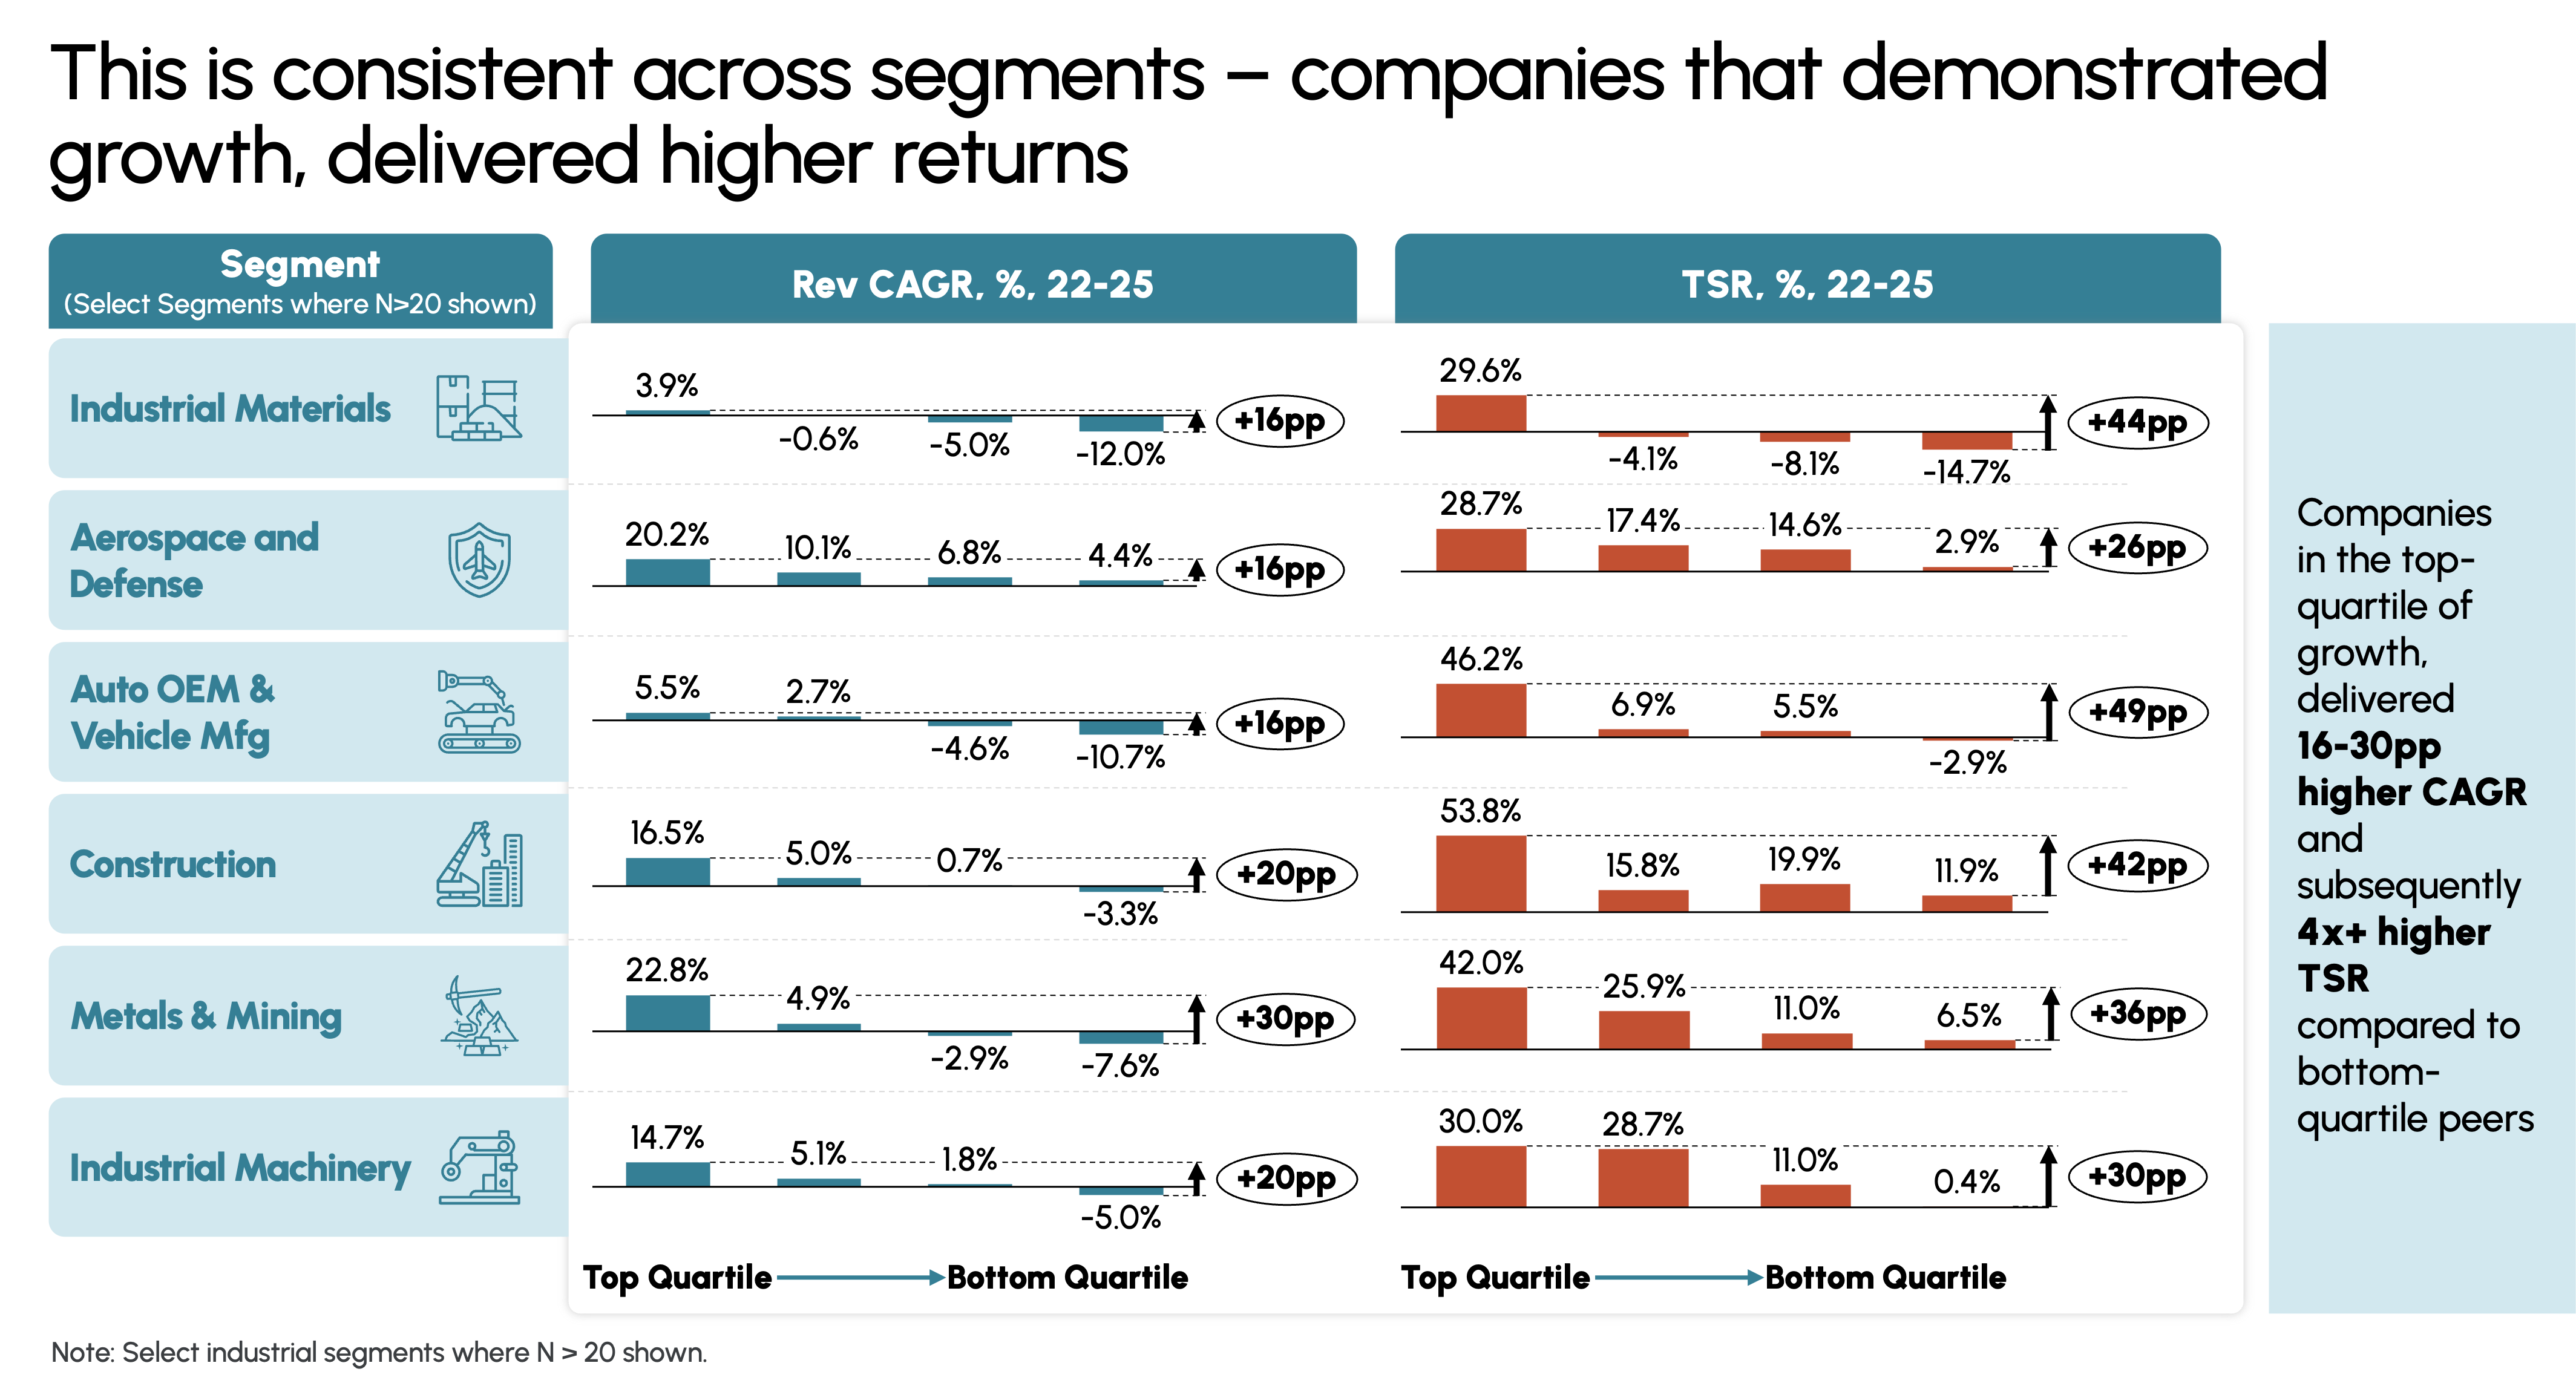
Across segments, top-quartile companies consistently outperform their bottom quartile peers:
- Aerospace & Defense: ~26pp TSR gap
- Construction: ~42pp gap
- Metals & Mining: ~36pp gap
Companies operating under the same macro conditions delivered materially different outcomes highlighting that execution, rather than external environment, is now the primary differentiator.
Conclusion
The industrial landscape of 2025 is defined by contrast. On one hand, the sector has demonstrated that it can withstand inflation, tariff shocks, and rising borrowing costs through disciplined margin management. On the other, the market has shifted its expectations, placing a clear premium on growth. Companies that fail to grow are not just underperforming; they are being structurally devalued.
For industrial leaders, the mandate is clear: Resilience is the baseline—but sustainable growth is the only path to superior valuation.