

Listen Now


How Industrial Tech Companies Must Reinvent to Win the New Era
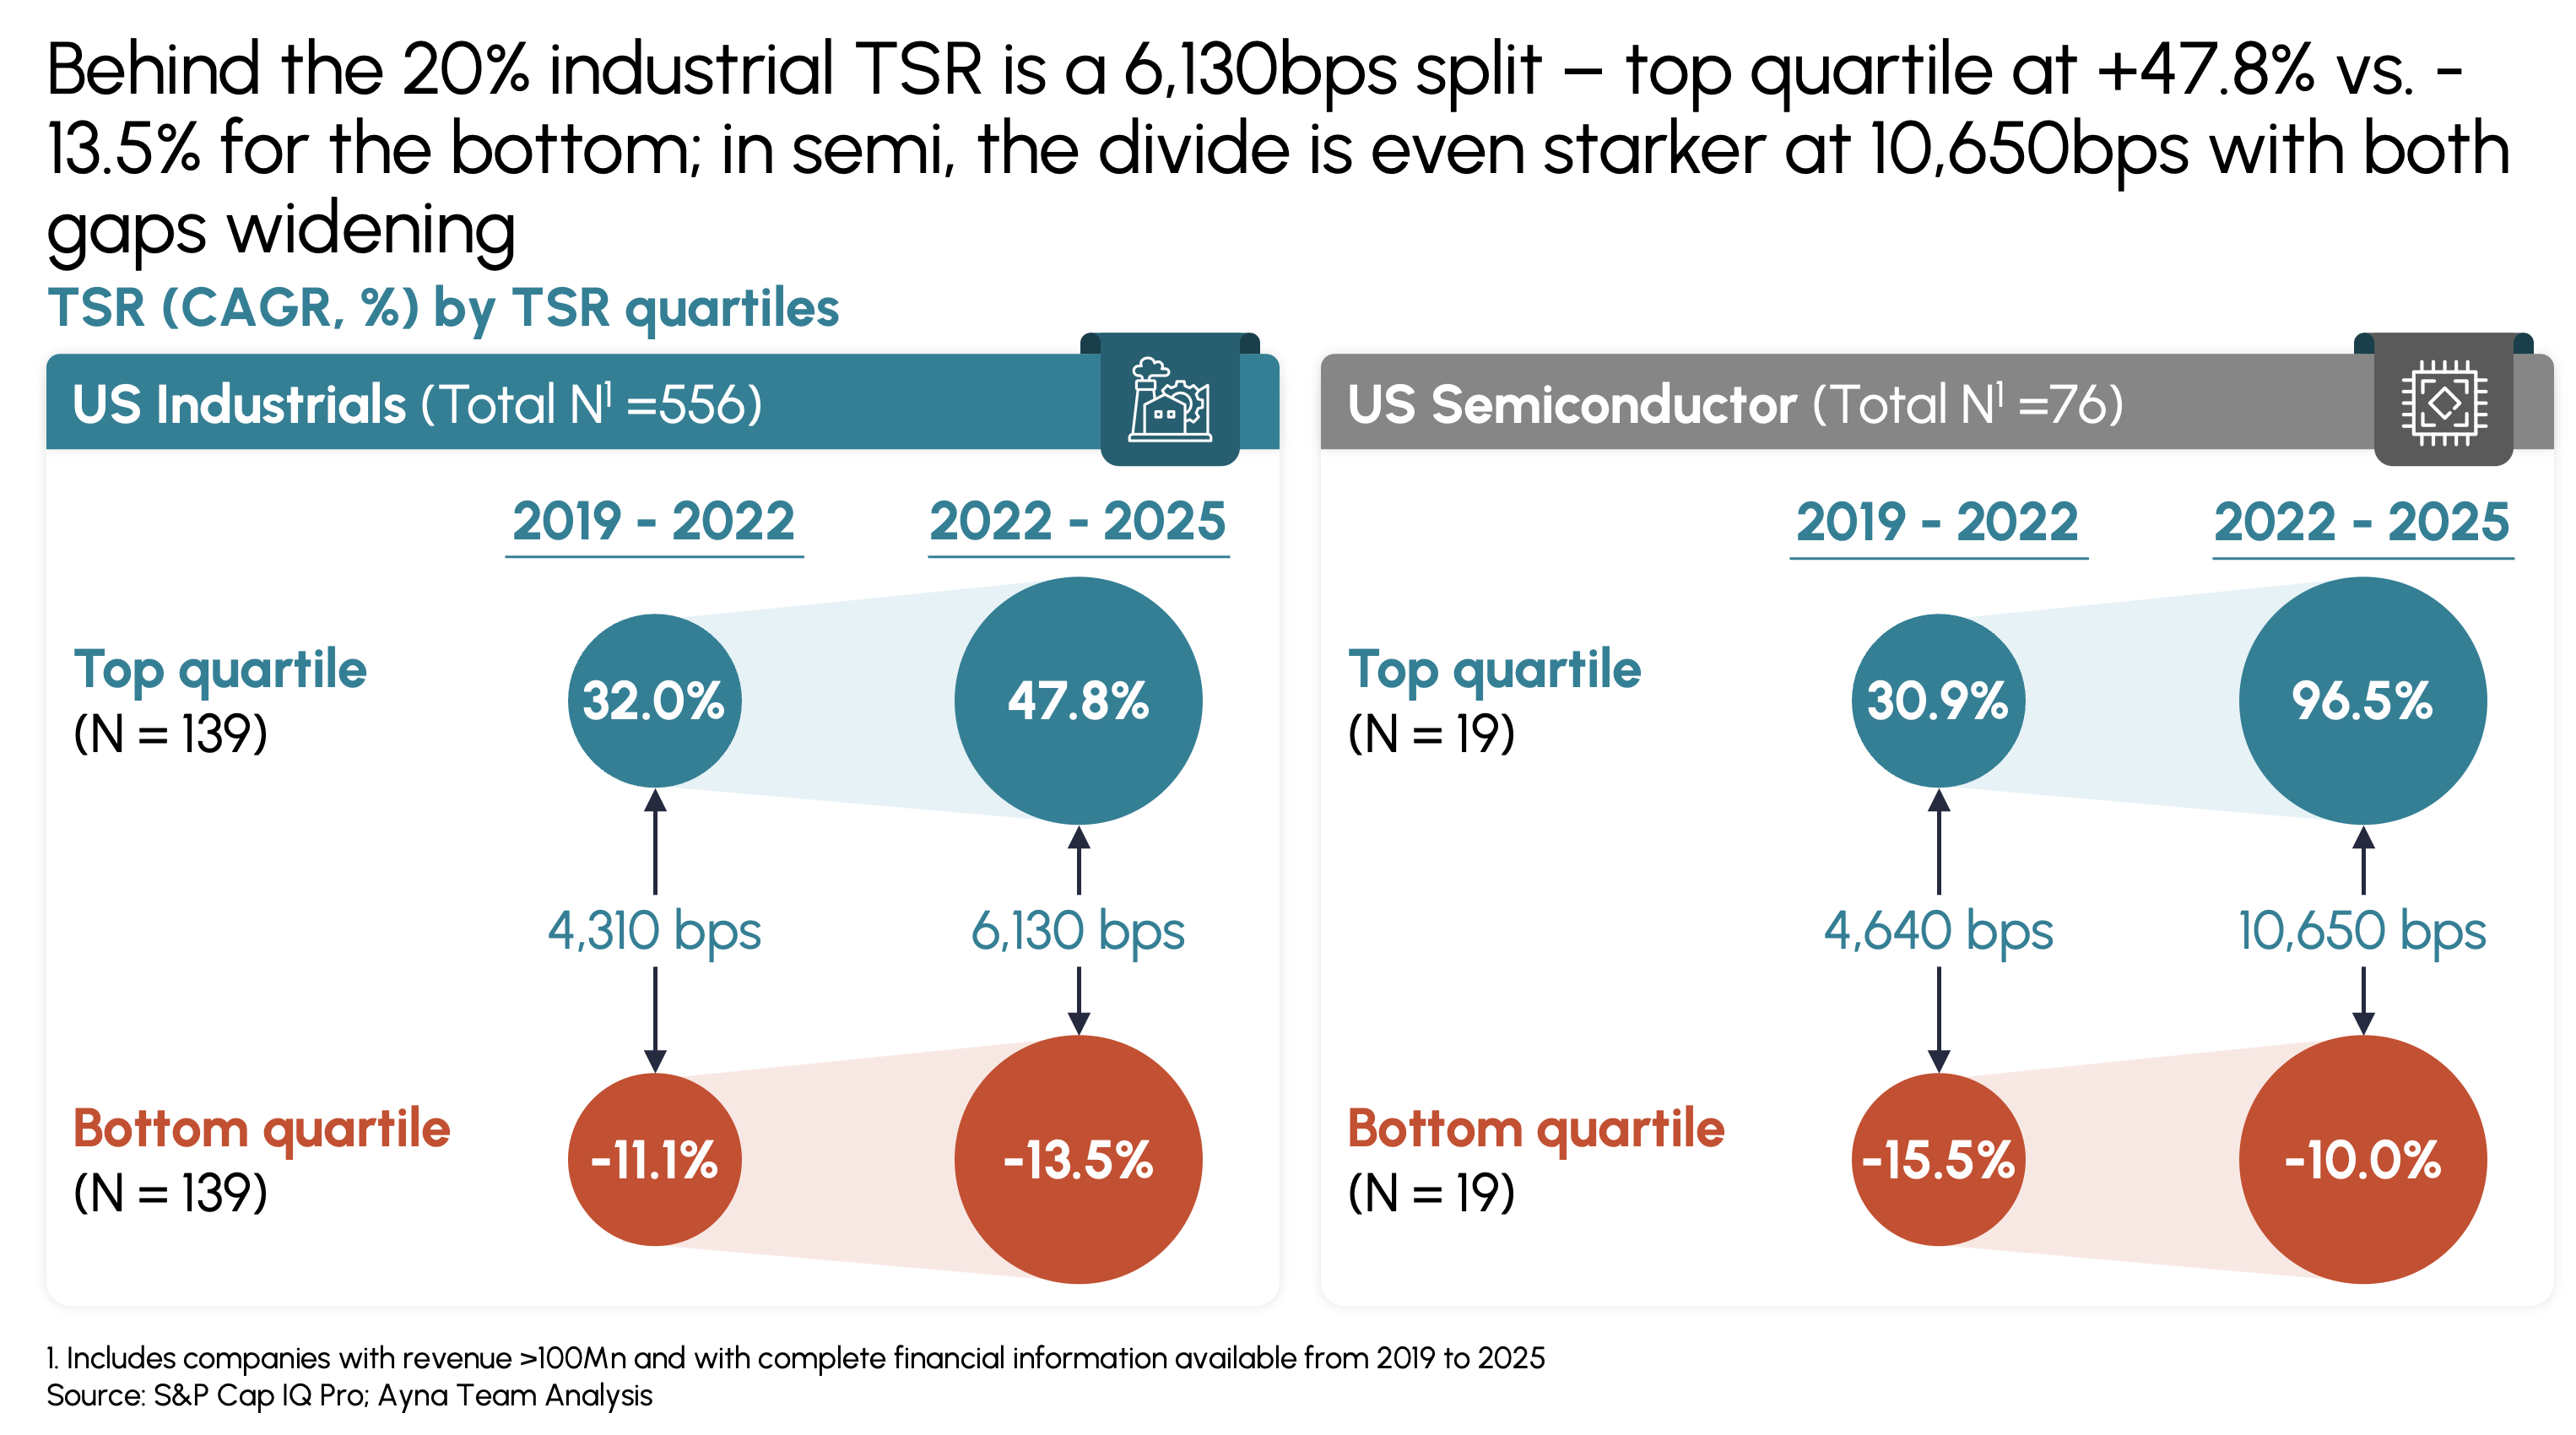
Industrial Technology delivered a 20% total shareholder return CAGR over the last three years–fifth among all major US sectors. The headline sounds strong. Behind it lies a 6,130 basis-point chasm: top-quartile industrials compounded at 47.8%, while the bottom quartile returned -13.5%. In semiconductors, the spread is 10,650 basis points. Both gaps are widening. The sector is not declining; it is diverging, and the divergence is accelerating.
Five structural ruptures are driving this divergence. All five are compounding, and none is reversible on any planning horizon that matters. Together, they are sorting Industrial Tech into two camps: companies building structural advantages, and companies still explaining why last quarter was an anomaly.
The New Era – Five Ruptures That Will Compound
1. Geopolitics is redrawing trade and supply-chain maps. The US-China share of global trade has fallen nine percentage points in seven years – the fastest reversal since the 1930s. The gap between within-bloc and cross-bloc trade has widened to roughly 45 percentage points against the 2017 baseline. Mexico overtook China as the number one US import source in 2023. US manufacturing construction spending peaked at $240 billion in 2024. Inventory days for US industrials rose from 80 to 97– a 20 percent plus increase since 2019 and have not reverted, even as carrying costs doubled. The just-in-case model is now the strategy, and companies that locked in domestic and near-shore suppliers on long-term contracts hold structural cost advantages that latecomers cannot replicate.
2. The cost structure has reset. For 15 years before 2020, industrial wages grew at 1.9% per year. That era is over. Manufacturing wages now compound at 5.0%, construction at 4.3%, transportation at 6.5%. Aluminum is up 53%, copper 26%, HRC steel 23%. China controls processing of nearly every critical mineral that matters to the industrial economy. Cost plus pricing, tolerable when inputs were stable, has become a margin trap–the companies that repriced permanently are the ones whose margins held.
3. Capital is no longer free. Industrial WACC has shifted 250–300 basis points permanently, with $480 billion in debt maturing between 2026 and 2028 at sub-4% rates, now repricing at the full premium. M&A multiples have compressed from 12x to 9x – a 25% compression in two years. Balance sheet strength is no longer a nice-to-have: a 1,000 basis-point TSR gap separates top from bottom interest coverage quartiles.
4. The market does not notice until you make it. Sub-one-billion-dollar industrials averaged just 3.2 analysts in 2025, down from 3.7 in 2019, while companies above $20 billion averaged 20.9, up from 18.2. The valuation gap has widened in tandem: sub-billion-dollar companies trade at 0.8x EV/Sales, down from 0.9x in 2019, while companies above $20 billion trade at 3.9x, up from 2.2x. AI and mega-cap mania have absorbed analyst attention and investor AUM. A mid-cap industrial with strong fundamentals can be invisible simply because no one is covering it.
5. There is AI, and then there is digitization. AI mentions on industrial earnings calls surged 20-fold. But only 35% of companies have deployed AI where it matters–three or more operational nodes across core functions. Fully 14.4% remain unsure whether to adopt AI at all. Meanwhile, the industrial buying process is being consumerized: more than one-third of US public industrials now operate a dedicated digital sales channel, up from roughly 20% in 2013. MSC Industrial drives 64% of revenue through digital platforms. Fastenal generates 44.9% of sales through automated vending. Motion Industries has reached 45% digital sales. AI grabs the headline, but digitization–automated reordering, instant quoting, self-serve portals–is the infrastructure that embeds the supplier into the customer’s workflow.
Where Industrial Tech Stands Today
Against these five ruptures, the headline performance of the industrial sector appears robust. Industrials delivered a 20% total shareholder return CAGR over the last three years, moving up one spot to fifth among all major US sectors (Exhibit 1). Semiconductors led at a staggering 64%.
Exhibit 1

But the headline conceals a far more important story. Behind the 20% is a 6,130 basis-point spread. Top-quartile industrial companies compounded TSR at 47.8%, while the bottom quartile returned -13.5% (Exhibit 2). In semiconductors, the gap is 10,650 basis points: top quartile at 96.5% versus -10.0%. Both gaps are widening–the industrial spread was 4,310 basis points in the prior three-year window, and the semiconductor spread was 4,640. The ruptures are not hitting all companies equally. They are accelerating divergence, and that divergence is explained by three compounding advantages.
Exhibit 2
Three Compounding Advantages
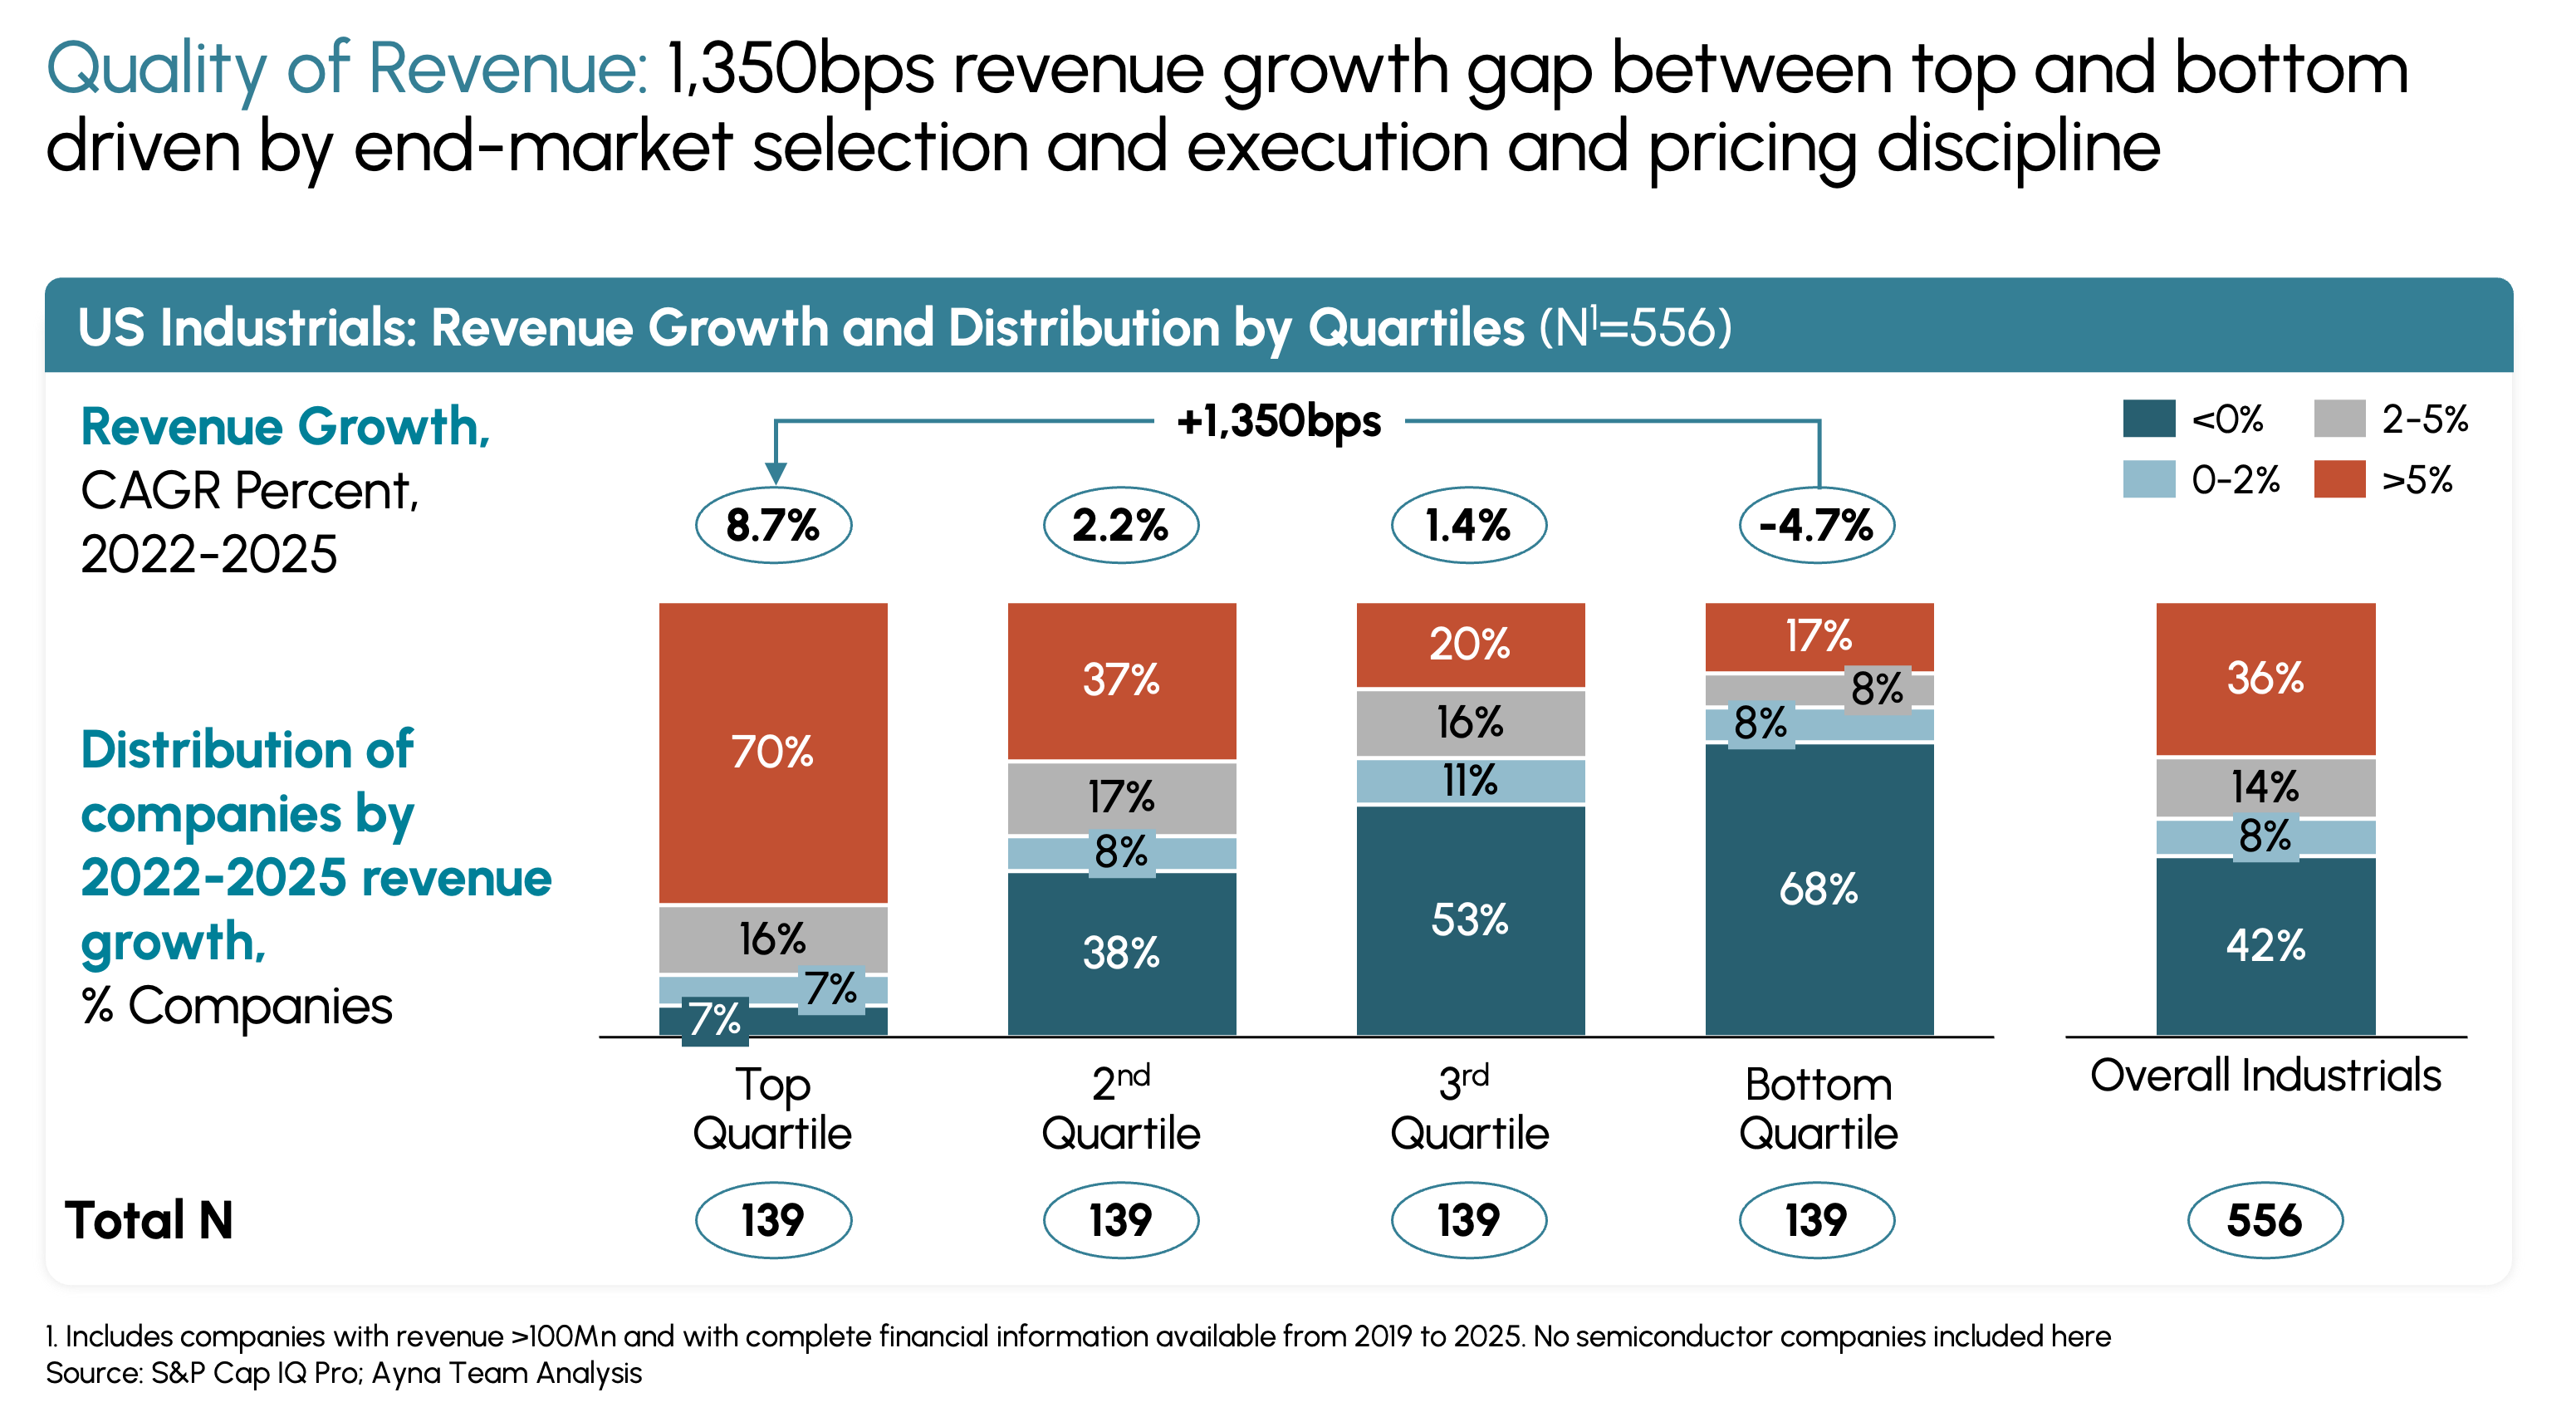
Quality of Revenue (QOR) measures whether a company’s revenue is positioned in structurally growing end markets, captured through direct channels rather than intermediary buffers, priced on customer value rather than cost plus, and reinforced by a recurring revenue mix. Top-quartile industrials grew revenue at 8.7% CAGR versus -4.7% for the bottom–a 1,350 basis-point gap (Exhibit 3). The first driver is end-market positioning: top-quartile companies had approximately 86% of revenue in tailwind end-markets versus just 12% for the bottom. But tailwind exposure is only the entry ticket–among 249 companies with 75%+ tailwind exposure, top quartile grew at 11.5% while peers grew at just 3.7%. Wrong channel and wrong product explain why strong positioning still fails.
Exhibit 3
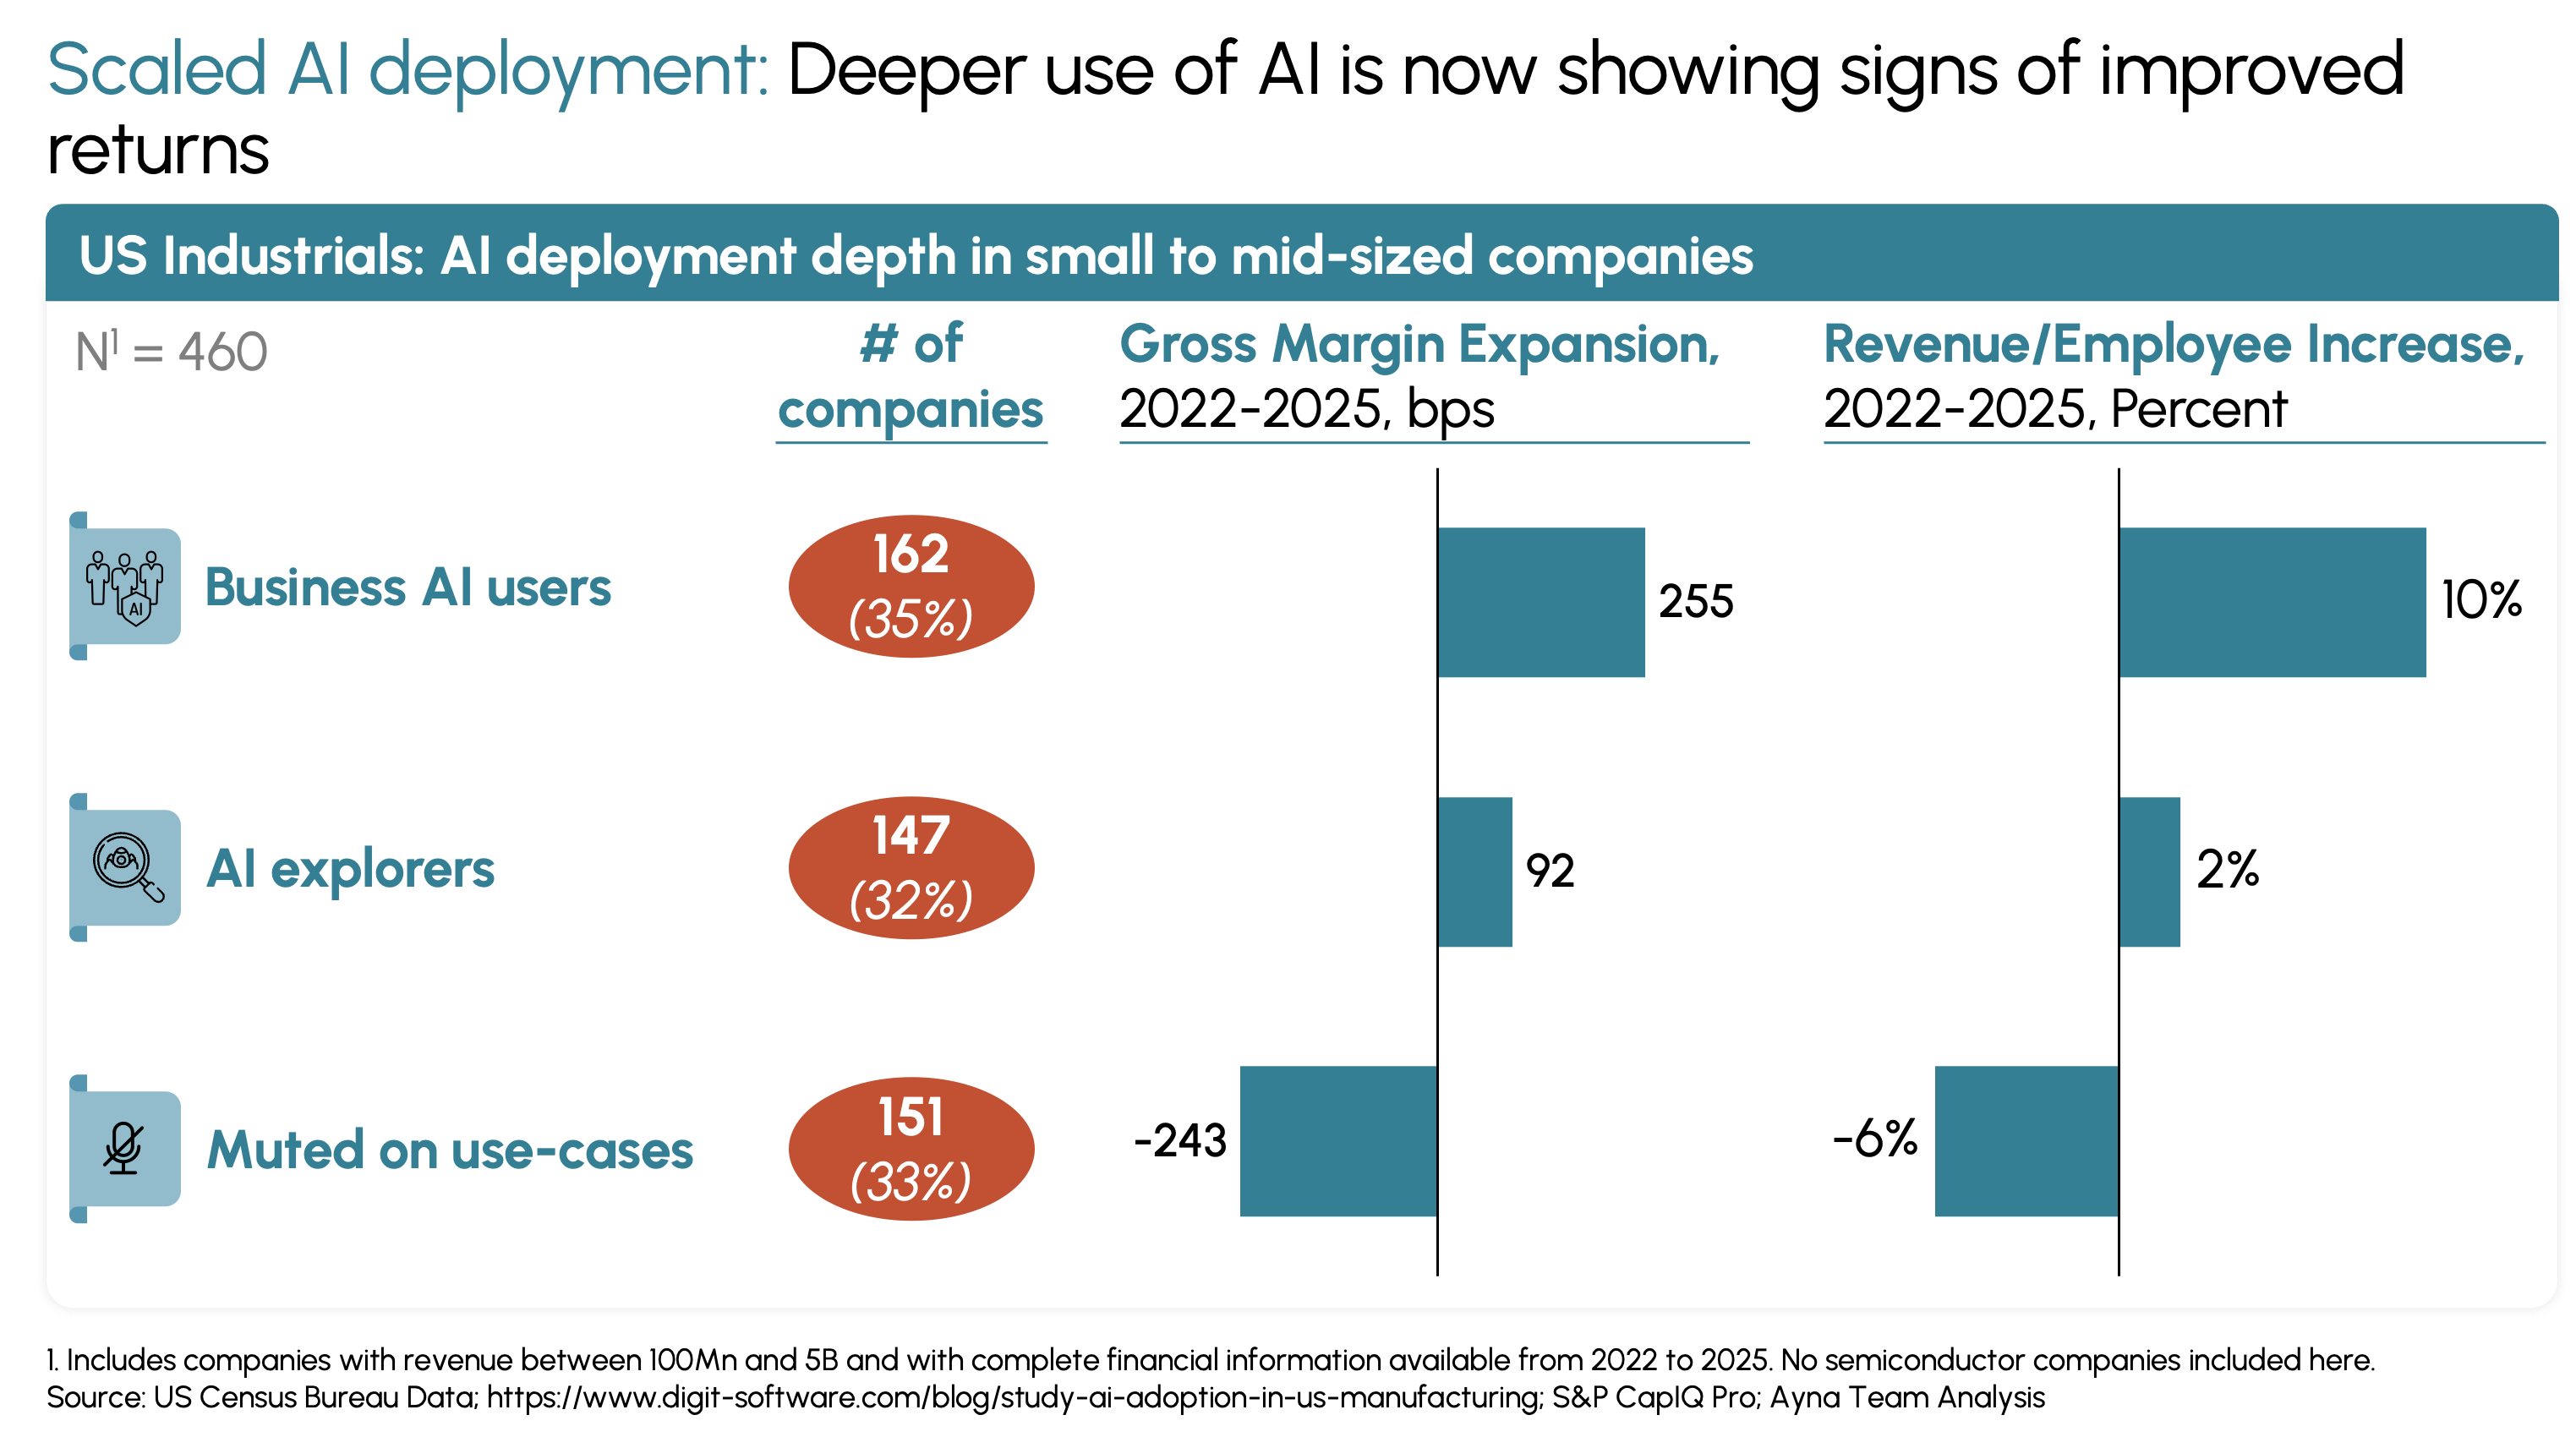
Resilience of Margin Structure (RMS) captures how “variablized” a company’s cost structure is–the first derivative of margin resilience relative to sales. Its correlation with TSR is 43%. Top-quartile RMS of 14% versus -27% for the bottom, with top-quartile companies expanding EBITDA 1.4x faster despite the same ruptures. Two levers explain the gap: supply-chain decisiveness (65% of top quartile acted versus 40% of bottom still in wait-and-watch mode, with first movers locking long-term contracts before tariff regimes hardened) and scaled AI deployment (Business AI users achieved 255 basis points of gross margin expansion versus -243 basis points for companies muted on use cases–a roughly 500-basis-point trajectory gap) (Exhibit 4).
Exhibit 4
Earned Valuation Premium (EVP) reflects a company’s ability to command a premium multiple through narrative discipline, blue-chip institutional ownership, and disciplined earnings communication. Top-quartile industrials trade at 5x EV/Sales–a top five ranking across all US sectors. Three levers earn it: roughly 80% of the highest-valued firms tell a compelling growth-returns story and the market re-rates them for it; companies with 25%+ ownership from top-twenty institutions signal quality and create a flywheel of coverage and visibility; and companies that own their miss see 3x better stock reactions than those who blame macro. Without EVP, operational excellence remains a private achievement that the stock price never reflects.
The New Era Playbook
Eight plays build the three advantages–Plays 1–3 build QOR, Plays 4–6 build RMS, Plays 7–8 build EVP (Exhibit 5). They are a connected system, not a menu.
Exhibit 5

Play 1: Pick Your End-Market, Then Win It. Exit anything below 10% growth; acquire into tailwinds. In semiconductors, 60% compute exposure meant 24% CAGR–controls and connectivity companies declined.
Play 2: Price on Value, Not Cost. Reprice high-lock SKUs as permanent base increases. Build ROI documentation per customer–uptime delivered, cost avoided. Surcharges are negotiations; structural reprices are statements of value.
Play 3: Build the Recurring Revenue Engine. Audit installed base by attach rate. Target a hard one-third recurring revenue floor. Exit lines where attachment is impossible.
Play 4: Redesign for the New Geography. Dual-source audit by SKU. One domestic alternative per critical input. Lock three-to-five-year contracts before the next tariff cycle. 65% of top-quartile companies have already acted; 40% of the bottom quartile are still waiting.
Play 5: AI as Operator, Not Assistant. Start with quoting, yield, freight–payback under six months. Named P&L owner per use case, ninety-day deadline. AI projects without business ownership produce demos, not margin.
Play 6: Convert Margin Gains into Cash. DIO/DSO/DPO diagnostic by site. Release 200–400 bps of trapped OCF. Companies that expanded OCF margins by 400+ bps delivered TSR nearly double that of peers.
Play 7: Attract Blue-Chip Owners Deliberately. Target five to eight quality funds. Twelve-month direct CFO engagement. Three public commitments, reported quarterly.
Play 8: Tell the Story Until the Market Listens. CFO on earnings prep four weeks out. Narrative built on tailwind exposure, margin trajectory, and a forward-looking growth story. Narrative discipline is the last mile between operational excellence and market value.
The window to build these advantages is open now and narrowing with every quarter. First movers on supply-chain redesign have already locked in contracts at favorable economics. Companies deploying AI operationally are capturing the 255 basis points of gross margin expansion that separates Business AI users from the rest. Blue-chip investors are sorting industrials into “own” and “ignore.” The next tariff cycle, the next supply shock, the next rate repricing will find two kinds of companies: those that built structural advantages during the ruptures, and those still explaining why last quarter was an anomaly. The eight plays are not a list to aspire to–they are the standard against which every CEO and CFO in Industrial Technology will be measured, starting now.