Listen Now
Building products is a cyclical but resilient industry with industry growth trends that follow housing cycles, stabilized by remodeling trends. An economic recovery seems likely to be delayed for another 12 to 18 months, but there are favorable indicators of a residential rebound, industrial demand, and continuing investments in infrastructure. Meanwhile, opportunities are emerging for managers and investors alike. Relative winners during the recent downturn provide examples for company leaders and investors.
A Fragmented, Resilient Industry
The building products industry is highly fragmented, with a large base of privately held companies in 12 micro-verticals: the 11 interior and exterior product categories listed in Table 1 plus a micro-vertical for other exterior products. More than 1,000 companies provide decking and landscaping, and more than 6,000 offer bathroom fittings.
Table 1. Building Products Companies, by Micro-Vertical and Ownership
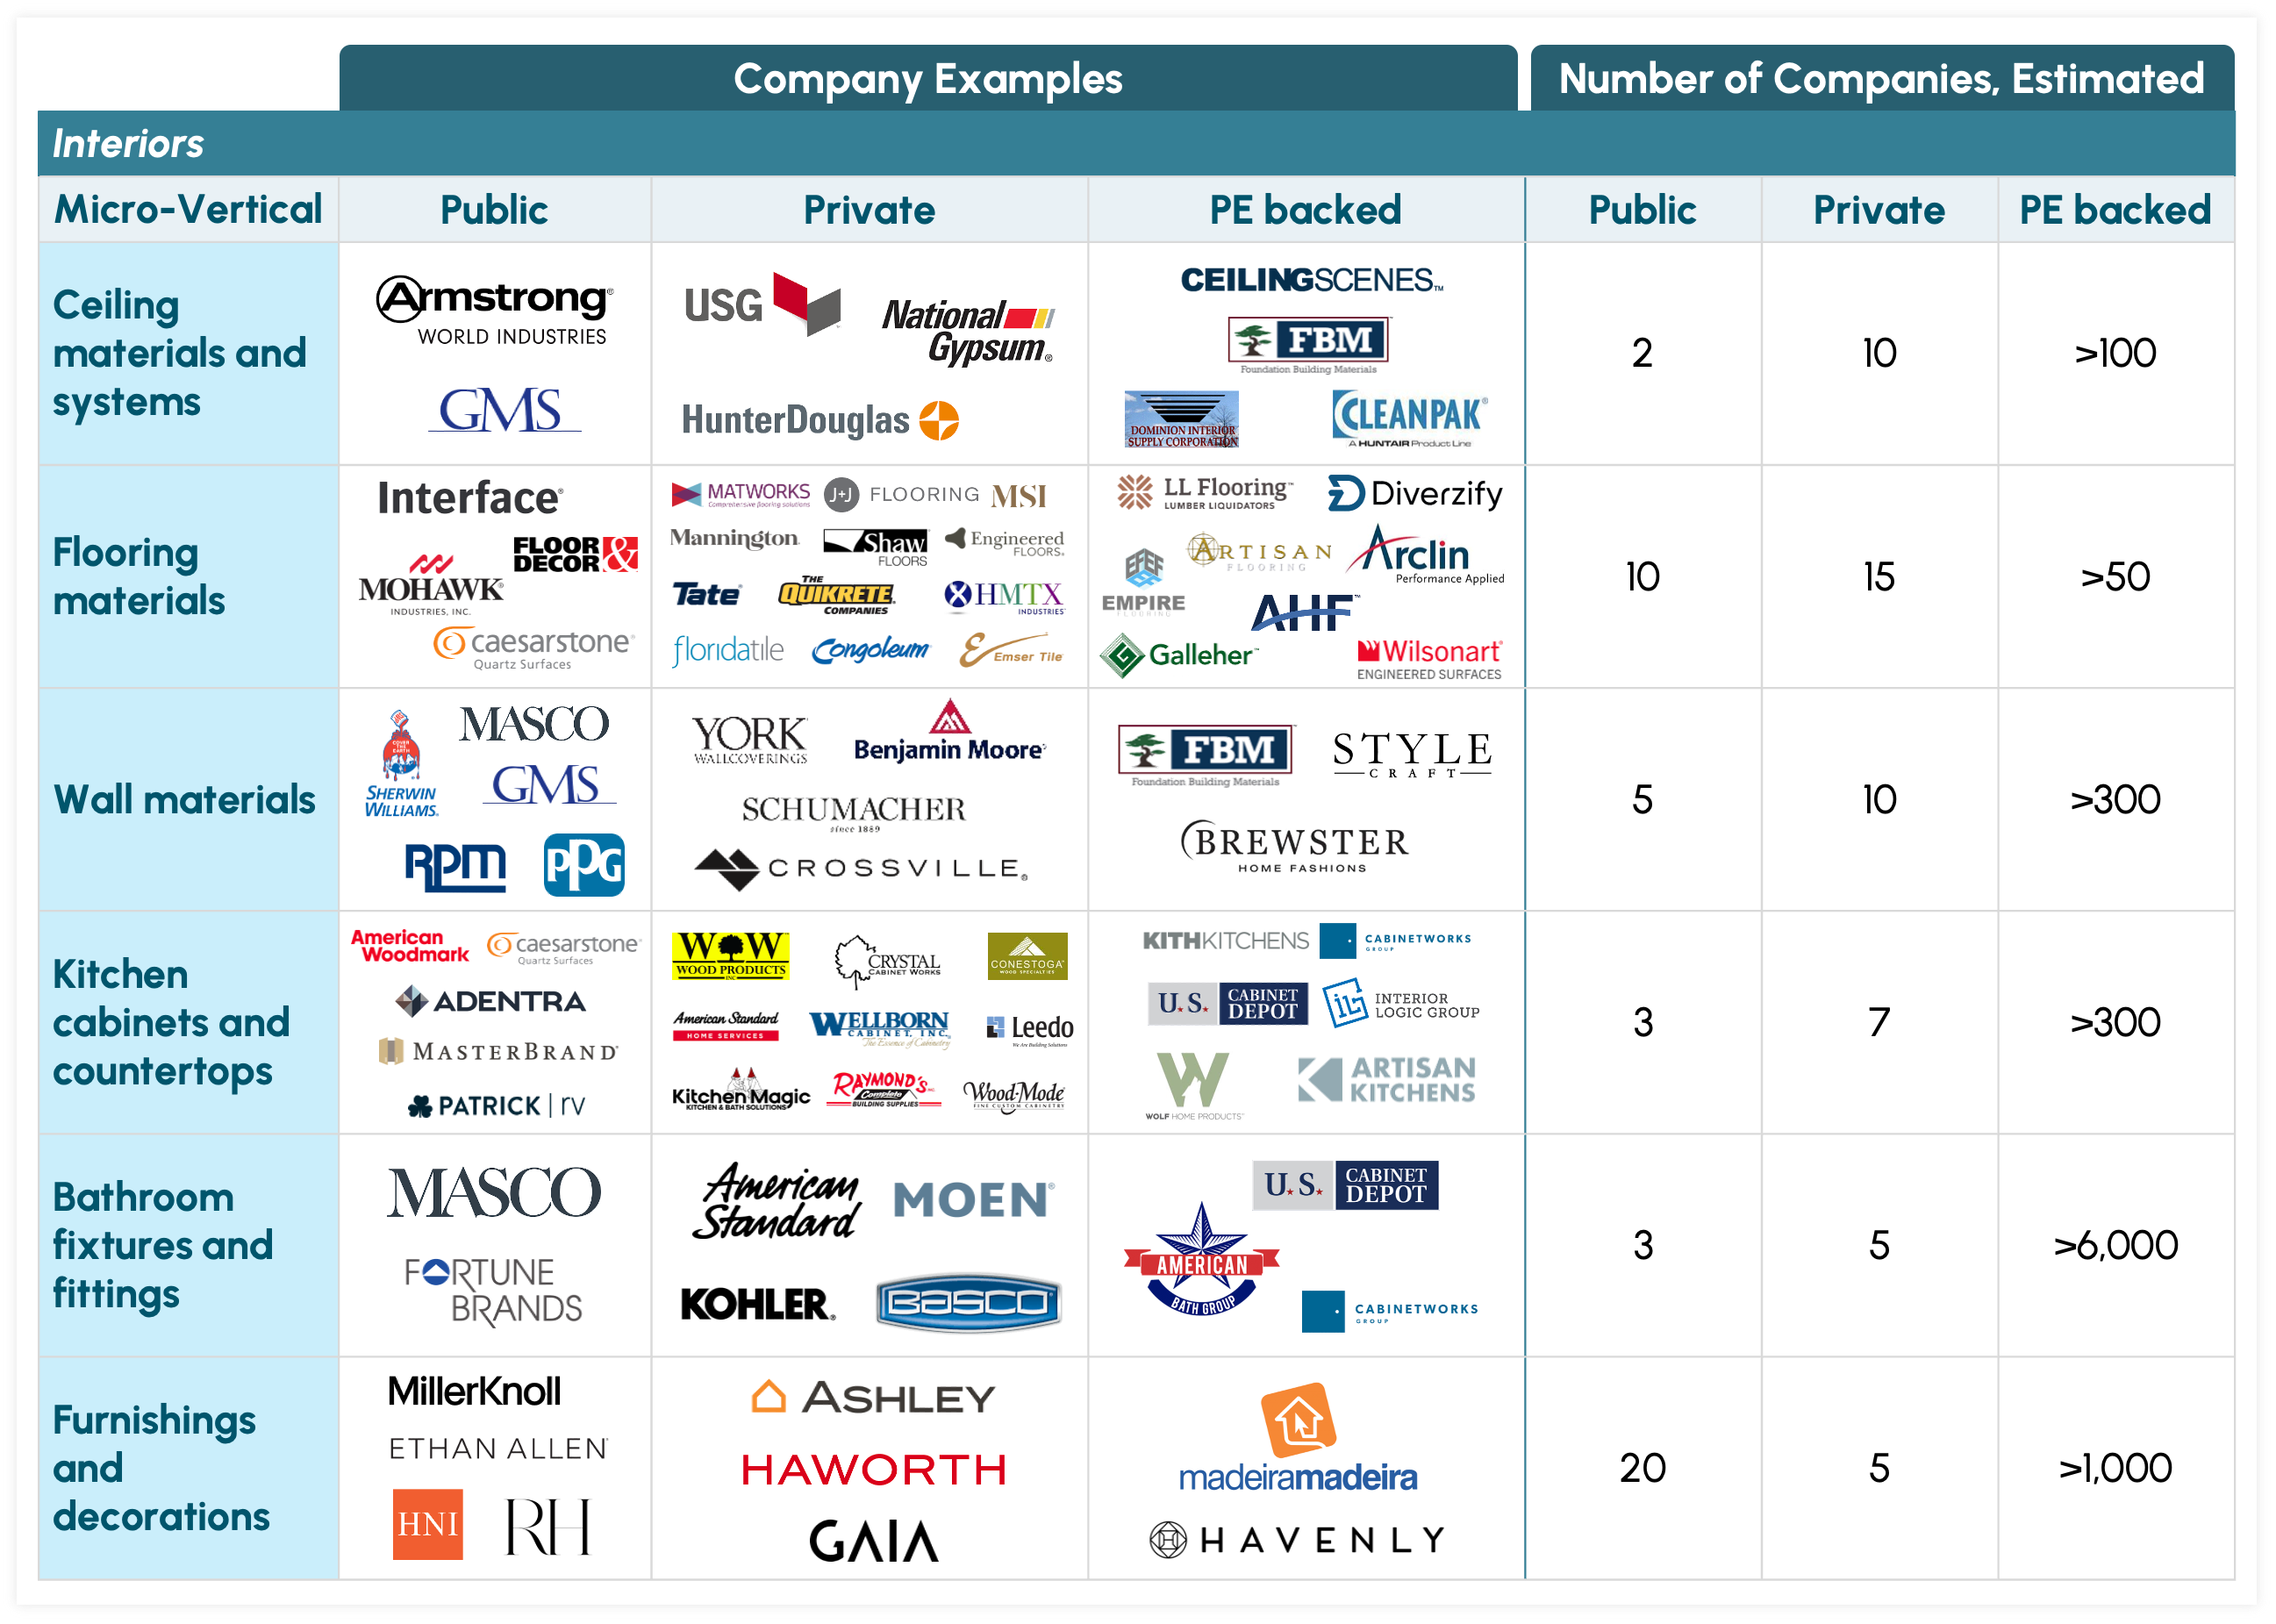
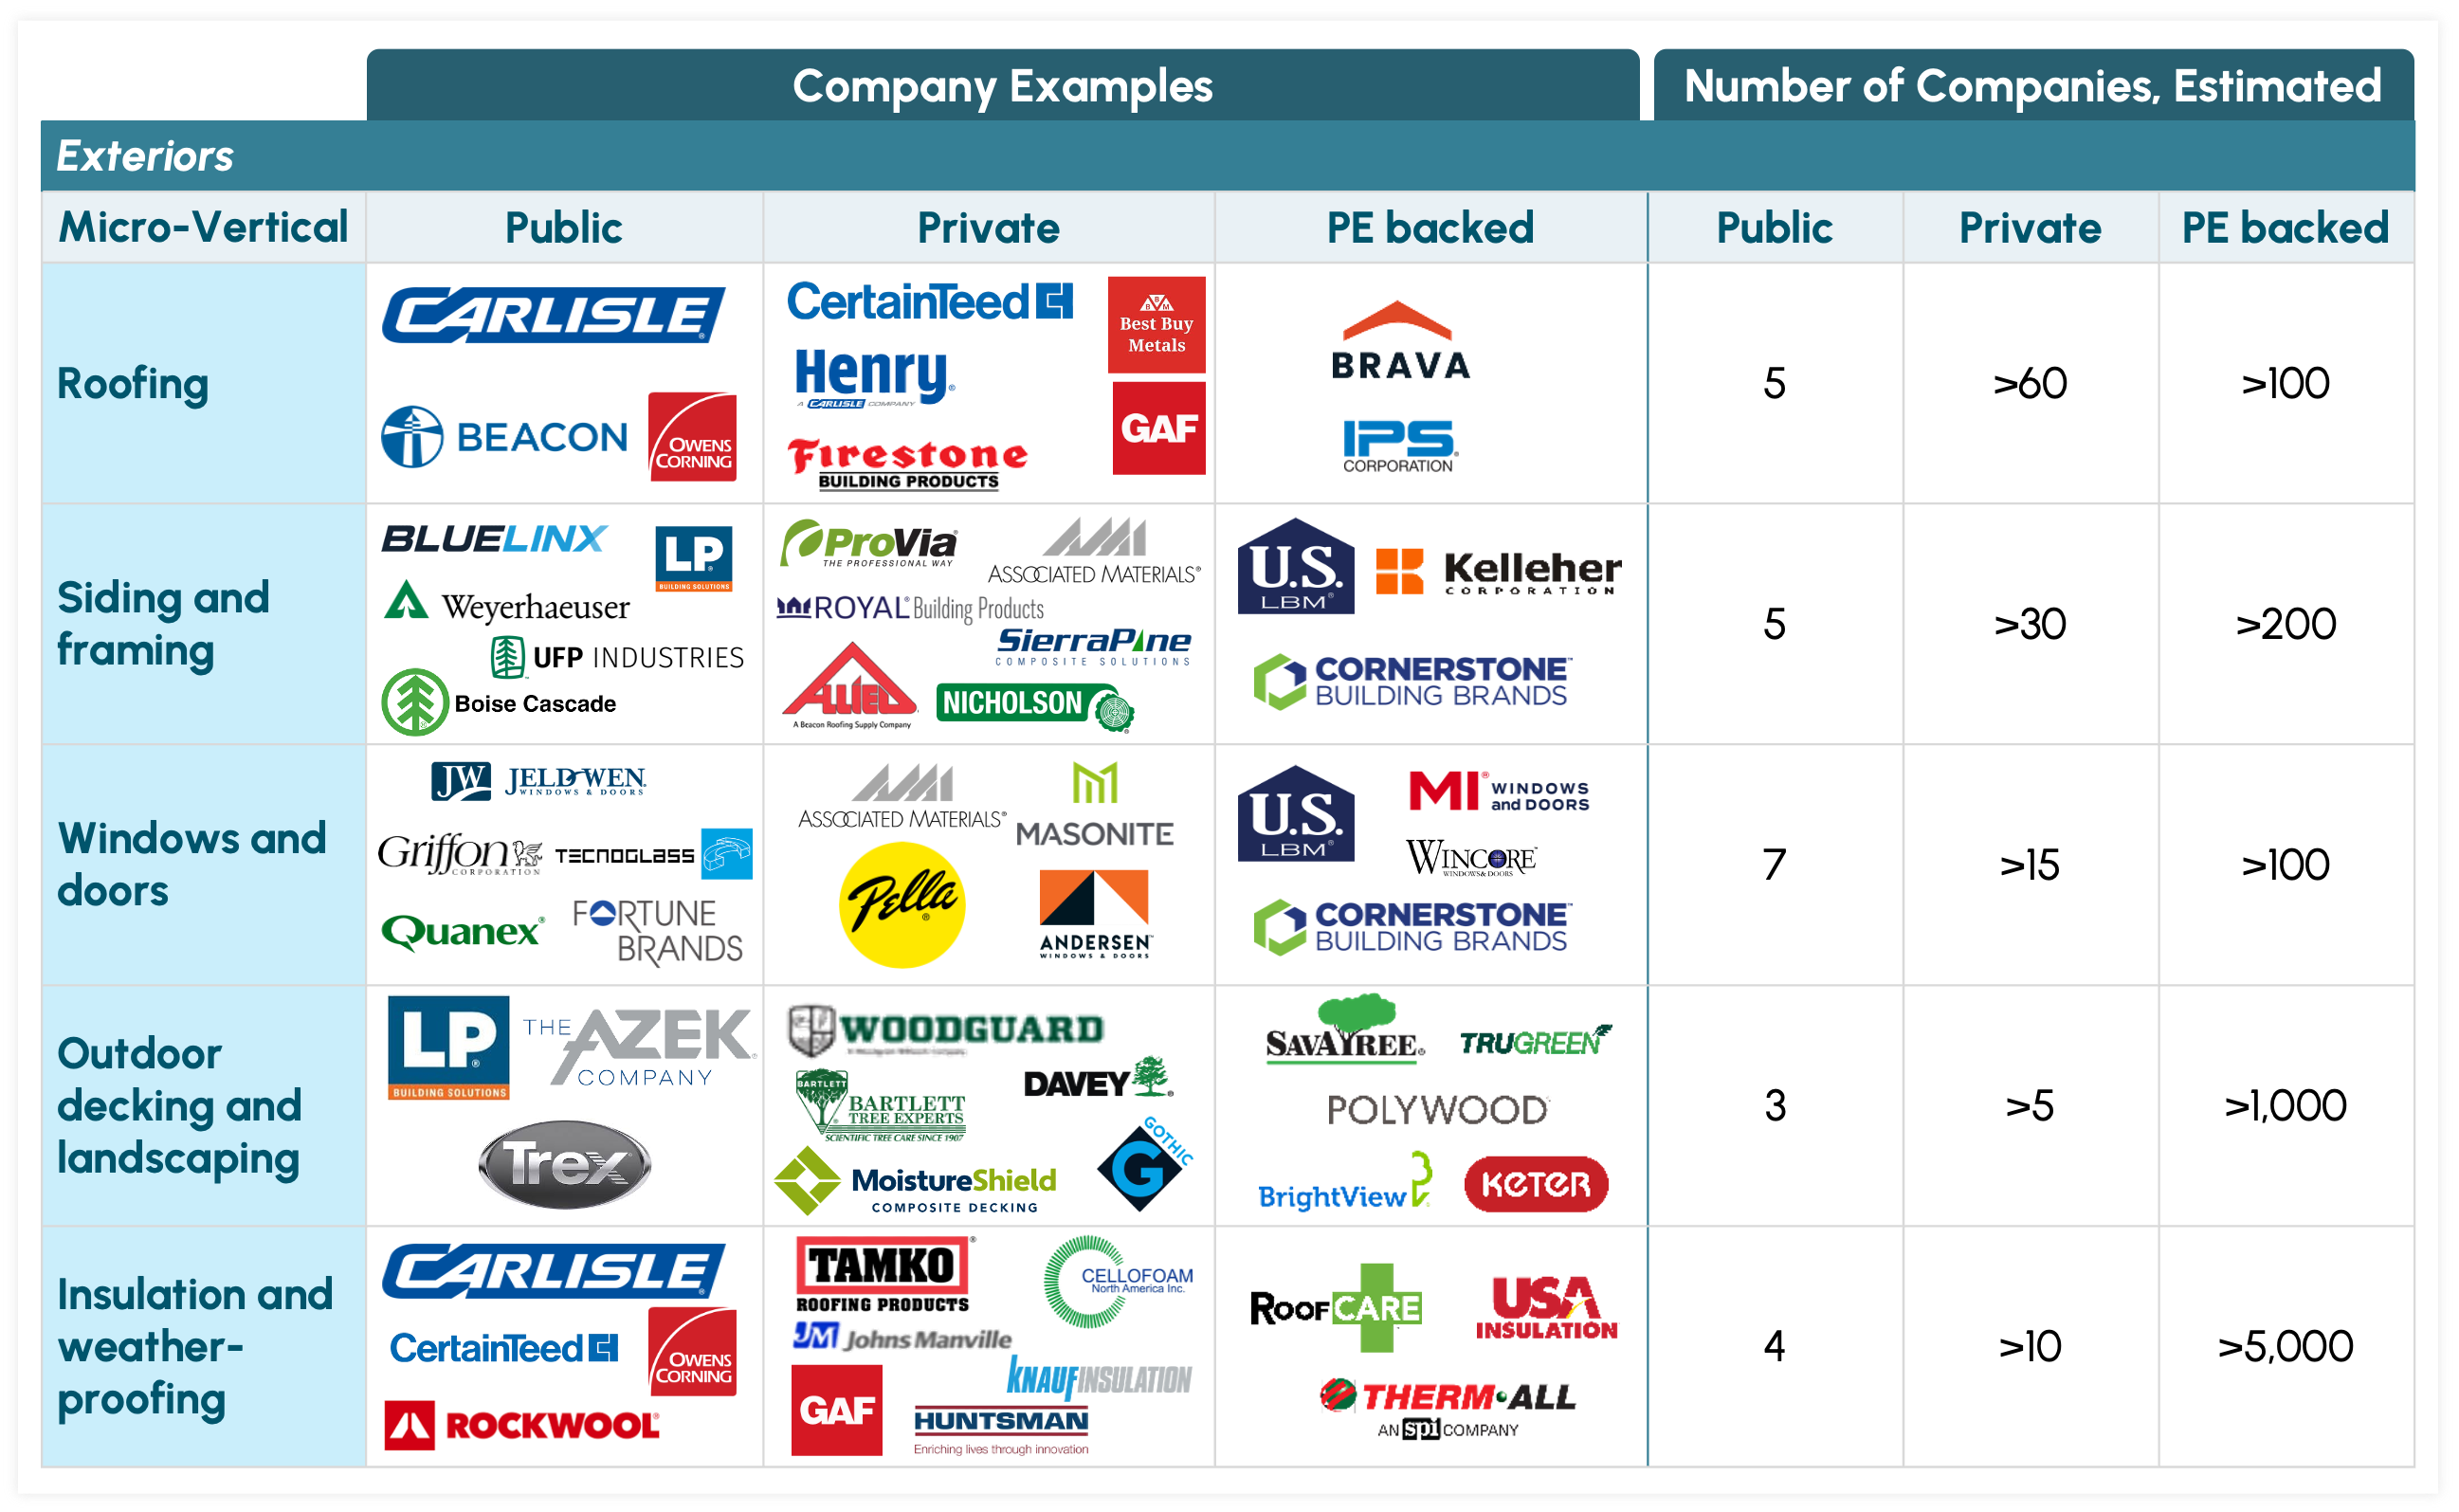
The US market for building products totals $355 billion, split almost equally between exteriors ($185 billion) and interiors ($170 billion). In exteriors, the siding and framing vertical is by far the largest, with a market size of $107 billion. In interiors, no micro-vertical is so dominant.
The industry follows the cycle for residential real estate. The last cycle, from 2019 to 2024, peaked in 2021 and then declined in response to high costs from supply chain disruptions, rapidly rising interest rates, and affordability pressures of the post-COVID period. The key limiter of near-term housing demand continues to be mortgage rates.
The cyclical pattern is moderated by the ongoing demand for repair and remodeling. Aging housing stock and population growth support sustained replacement and remodeling. During the COVID pandemic, new housing starts declined, but demand for repair and remodeling has held steady.
A Pause on Growth
Cause for Caution
Companies seeking growth may be stymied by several pressures:
- Supply constraints. US housing starts are not keeping up with demand. In 2014, the 646,000 single-family housing starts left an estimated shortage of 1.2 million homes; in the following year, 712,000 homes were built, and the gap widened to 1,680.1 The pattern continued through 2023, when the shortage reached 7.2 million.
- Demand drag. The demand side is just as unfavorable, mainly because of elevated mortgage rates, which are at 6.8%, two points above the 10-year average. High rates also intensify a housing affordability crisis. Nearly half of US households are unable to afford a home above $250,000, while roughly 75% cannot afford a median-priced home.2 Under these conditions, the US Pending Home Sales Index has nearly halved, dropping from 130.3 in August 2020 to 72 in June 2025.3
- Weak macro outlook. The macro outlook does not favor a strong housing market rebound. The Federal Reserve, after cutting the federal funds rate in the second half of 2024, entered a wait-and-see mode in response to uncertainty about the level and impact of tariffs. Mortgage rates have barely budged, with the 30-year fixed rate ticking down only slightly, from 7.04% to 6.08% and experts expecting 30-year and 15-year mortgage rates to stay elevated. Housing projects remain highly rate-sensitive, so rates are stalling new construction and permitting.
Meanwhile, a rare macro mix—rising Treasury yields and a falling dollar—is fueling inflation concerns and pushing mortgage rates higher.4 Rates on 30-year Treasuries are near 5.0%, up half a point from a year ago, while 10-year Treasuries have increased around a quarter point. A sharp drop in the value of the US dollar, combined with rising yields, signals lower confidence in the US dollar and its bonds, which could translate to import-driven inflation. Also, rising bond yields can make buying a home more expensive, because yields are a key factor in setting mortgage rates.
- Tariffs and labor market uncertainty. Tariffs and immigration policies are straining the sector. Tariffs have caused spikes in the price of important construction materials. Commercial construction is facing cost inflation of 8% to 12% on infrastructure projects. In the residential sector, materials inflation could add $5,000 to $20,000 to the price of a new home. Immigration policy also is significant. Immigrants make up 34% of the construction workforce, including 61% of drywallers and 52% of roofers. As immigration rates slow and deportations rise, fewer experienced workers remain.
A Stirring of Tailwinds
Although the building products industry is in the tough part of its cycle, some tailwinds are stirring across residential, commercial, and industrial/infrastructure markets.
Leading Indicators of Growth in Residential. Several signs suggest a residential recovery may be nearing. Household income grew in 2023 for the first time since 2019, and in February 2025, the National Association of Home Builders (NAHB) forecast that growth in the remodeling market will be a robust 5% for the year, with a further 3% nominal gain in 2026.5 In 2024, single-family construction increased in all geographic regions. Manufactured housing has grown at a 5% CAGR from 2019 to 2024, gaining momentum as households have come to view it as an affordable option. Construction and starts in smaller counties and lower-density areas are expanding as people look away from high-priced urban centers. And the accessory dwelling unit (ADU) market is growing rapidly, given housing shortages, cost increases, and potential to increase home values.
Initiatives in Industrial and Commercial. Construction of factories grew 32% year over year in 2022, 29% in 2023, and 14% in 2024. The growth in demand has been fueled by the reshoring of manufacturing and enabled by the CHIPS Act and the Infrastructure Investment and Jobs Act (IIJA) of 2022. Investments in US semiconductor facilities surged, with an average of $7.5 billion per month in construction investment from 2020 to 2024.
Commercial construction has been growing steadily since 2021 and is expected to surpass pre-COVID levels by 2026. Retail construction is growing to meet increased demand in suburban areas. Owners of office buildings are retrofitting them, boosted by aging stock, limited supply, and concerns for environmental sustainability.
Data Centers Leading the Way in Nonresidential. The massive demand for cloud infrastructure and AI has caused investment in data centers to surge. Spending on data center construction, which accounted for roughly 5% of total construction spending in 2014, now represents 32% of spending, with projections that the share could hit 40% by 2028.6
Some Winning Strategies
Given the significant challenges facing building products companies, how can they build resilience and prepare for future growth? To answer that question, we studied the performance of the top five public companies in building exteriors and the top five in building interiors, based on their 2019–24 growth in total shareholder returns (TSR). Others in the industry can benefit from investigating these ten companies’ strengths in product differentiation, operational excellence, digital transformation, strategic M&A, and channel strategy.
The Top Five in Exteriors
Overall, the companies providing building exterior products outperformed those in the interiors segment. Among the 16 publicly traded companies in building exteriors, the top five have 12% of the total market cap and expanded their five-year TSR by 35.6%. On a company-by-company basis, these five, with 2024 revenue between $2.9 billion and $16.4 billion, had impressive performance in TSR growth and EBITDA margins (see Exhibit 1):
Exhibit 1
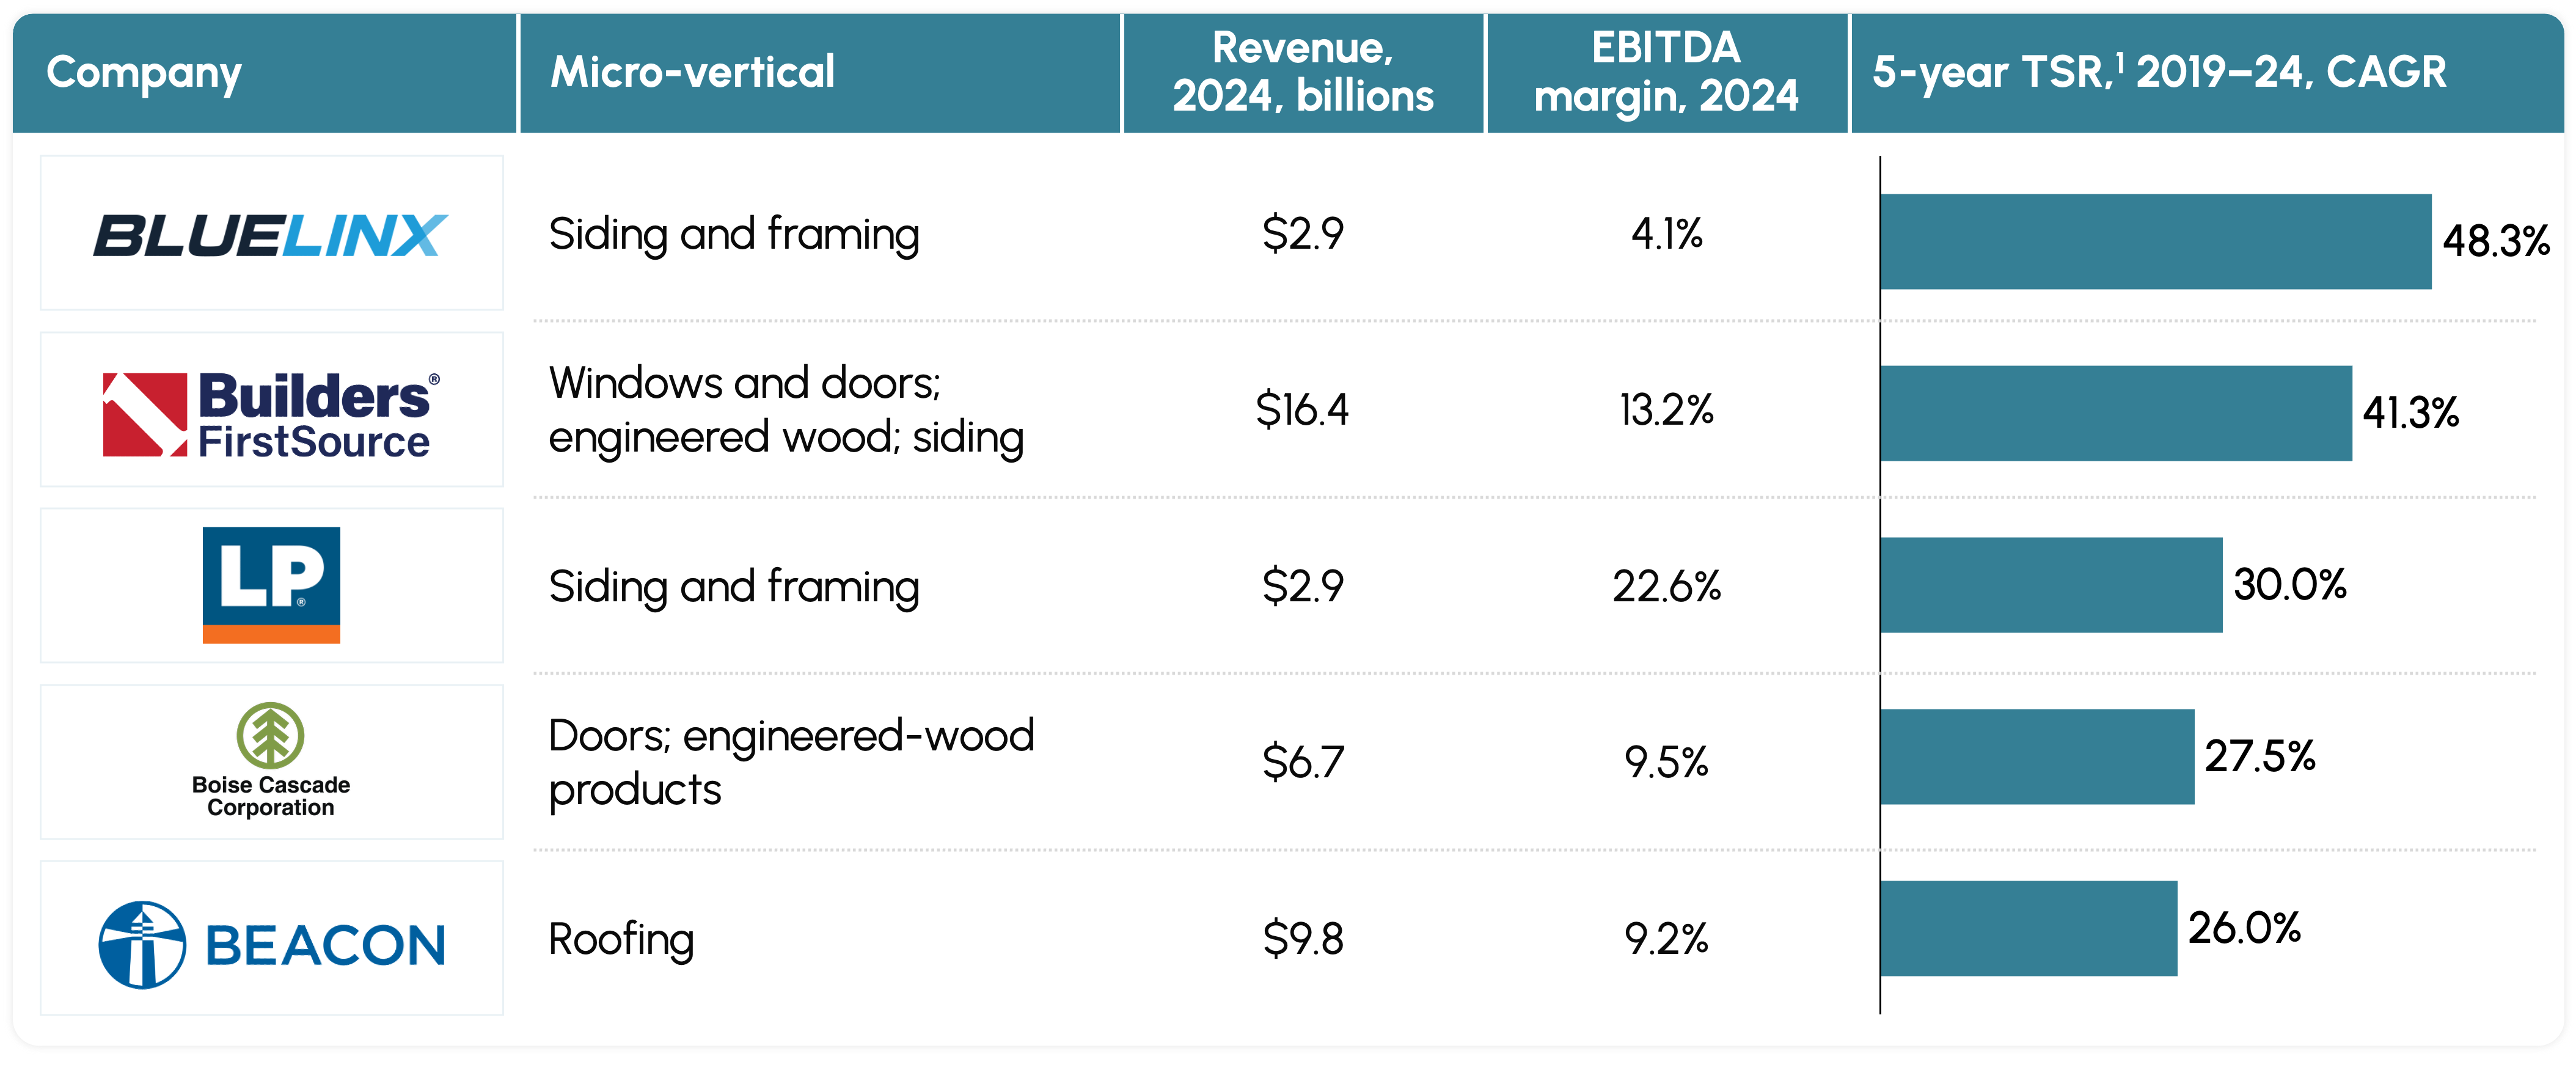
- BlueLinx, a leading distributor of residential and commercial building products focusing on lumbar, siding, roofing, and outdoor living products, posted the largest five-year TSR growth, 48.3%, driven by its portfolio of specialty products. The company also builds resilience on the cost side. Its structure gross margin has been consistently around 11%, and it invests in digital initiatives, including the development of an e-commerce platform.
- Builders FirstSource, the largest US supplier of structural building products, prefabricated components, and value-added services, has the greatest revenue of the five companies and an impressive EBITDA margin of 13.2%. The company leverages a strong value-added and digital services segment to complement its operational excellence, which is reflected in leverage ratios consistently below two times and a free cash flow (FCF) trailing 12-month yield of about 9%.
- Louisiana-Pacific, a leading manufacturer of high-performance engineered-wood building products, including framing, siding, and outdoor building solutions, employs a disciplined approach focused on returning cash to shareholders through innovation and expansion. In its siding product line, 14% of LP’s volume in 2024 came from recently launched products, helping the company achieve 25% EBITDA margin in 2024. LP is strategic about divesting businesses where high margins aren’t achievable.
- Boise Cascade, a leading manufacturer and distributor of engineered-wood products, plywood, and lumber, leveraged EBITDA margins of 9.5% to achieve shareholder returns of 27.5%. The company emphasizes a high-volume product mix and stable inventory. It benefits from selling a product for which demand growth is outpacing the rate of single-family home starts. Boise Cascade strengthens margins with new SKUs and reliable order fulfillment. Its effective approach to capital expenditures directs roughly equal shares to foundation, modernization, and capacity completion.
- Beacon, a distributor focused on roofing materials and complementary building products like siding, waterproofing, windows, and decking, rounds out the top five with revenue of $9.8 billion, margins of 9.2%, and five-year TSR of 26.0%. Beacon is scaling its physical and digital network, powered by solid operations and a strong product lineup. Providing an e-commerce option also enables growth.
The Top Five in Interiors
Although building interiors overall added less value than exteriors in 2019–24, the top five companies managed to shine. Among the 23 publicly traded companies in building interiors, the top five have 40% of the total market cap and expanded their five-year TSR by 14.5%. On a company-by-company basis, these five, with 2024 revenue between $0.4 billion and $23.1 billion, had impressive performance in TSR growth, and four had EBITDA margins above 20% (Exhibit 2):
Exhibit 2
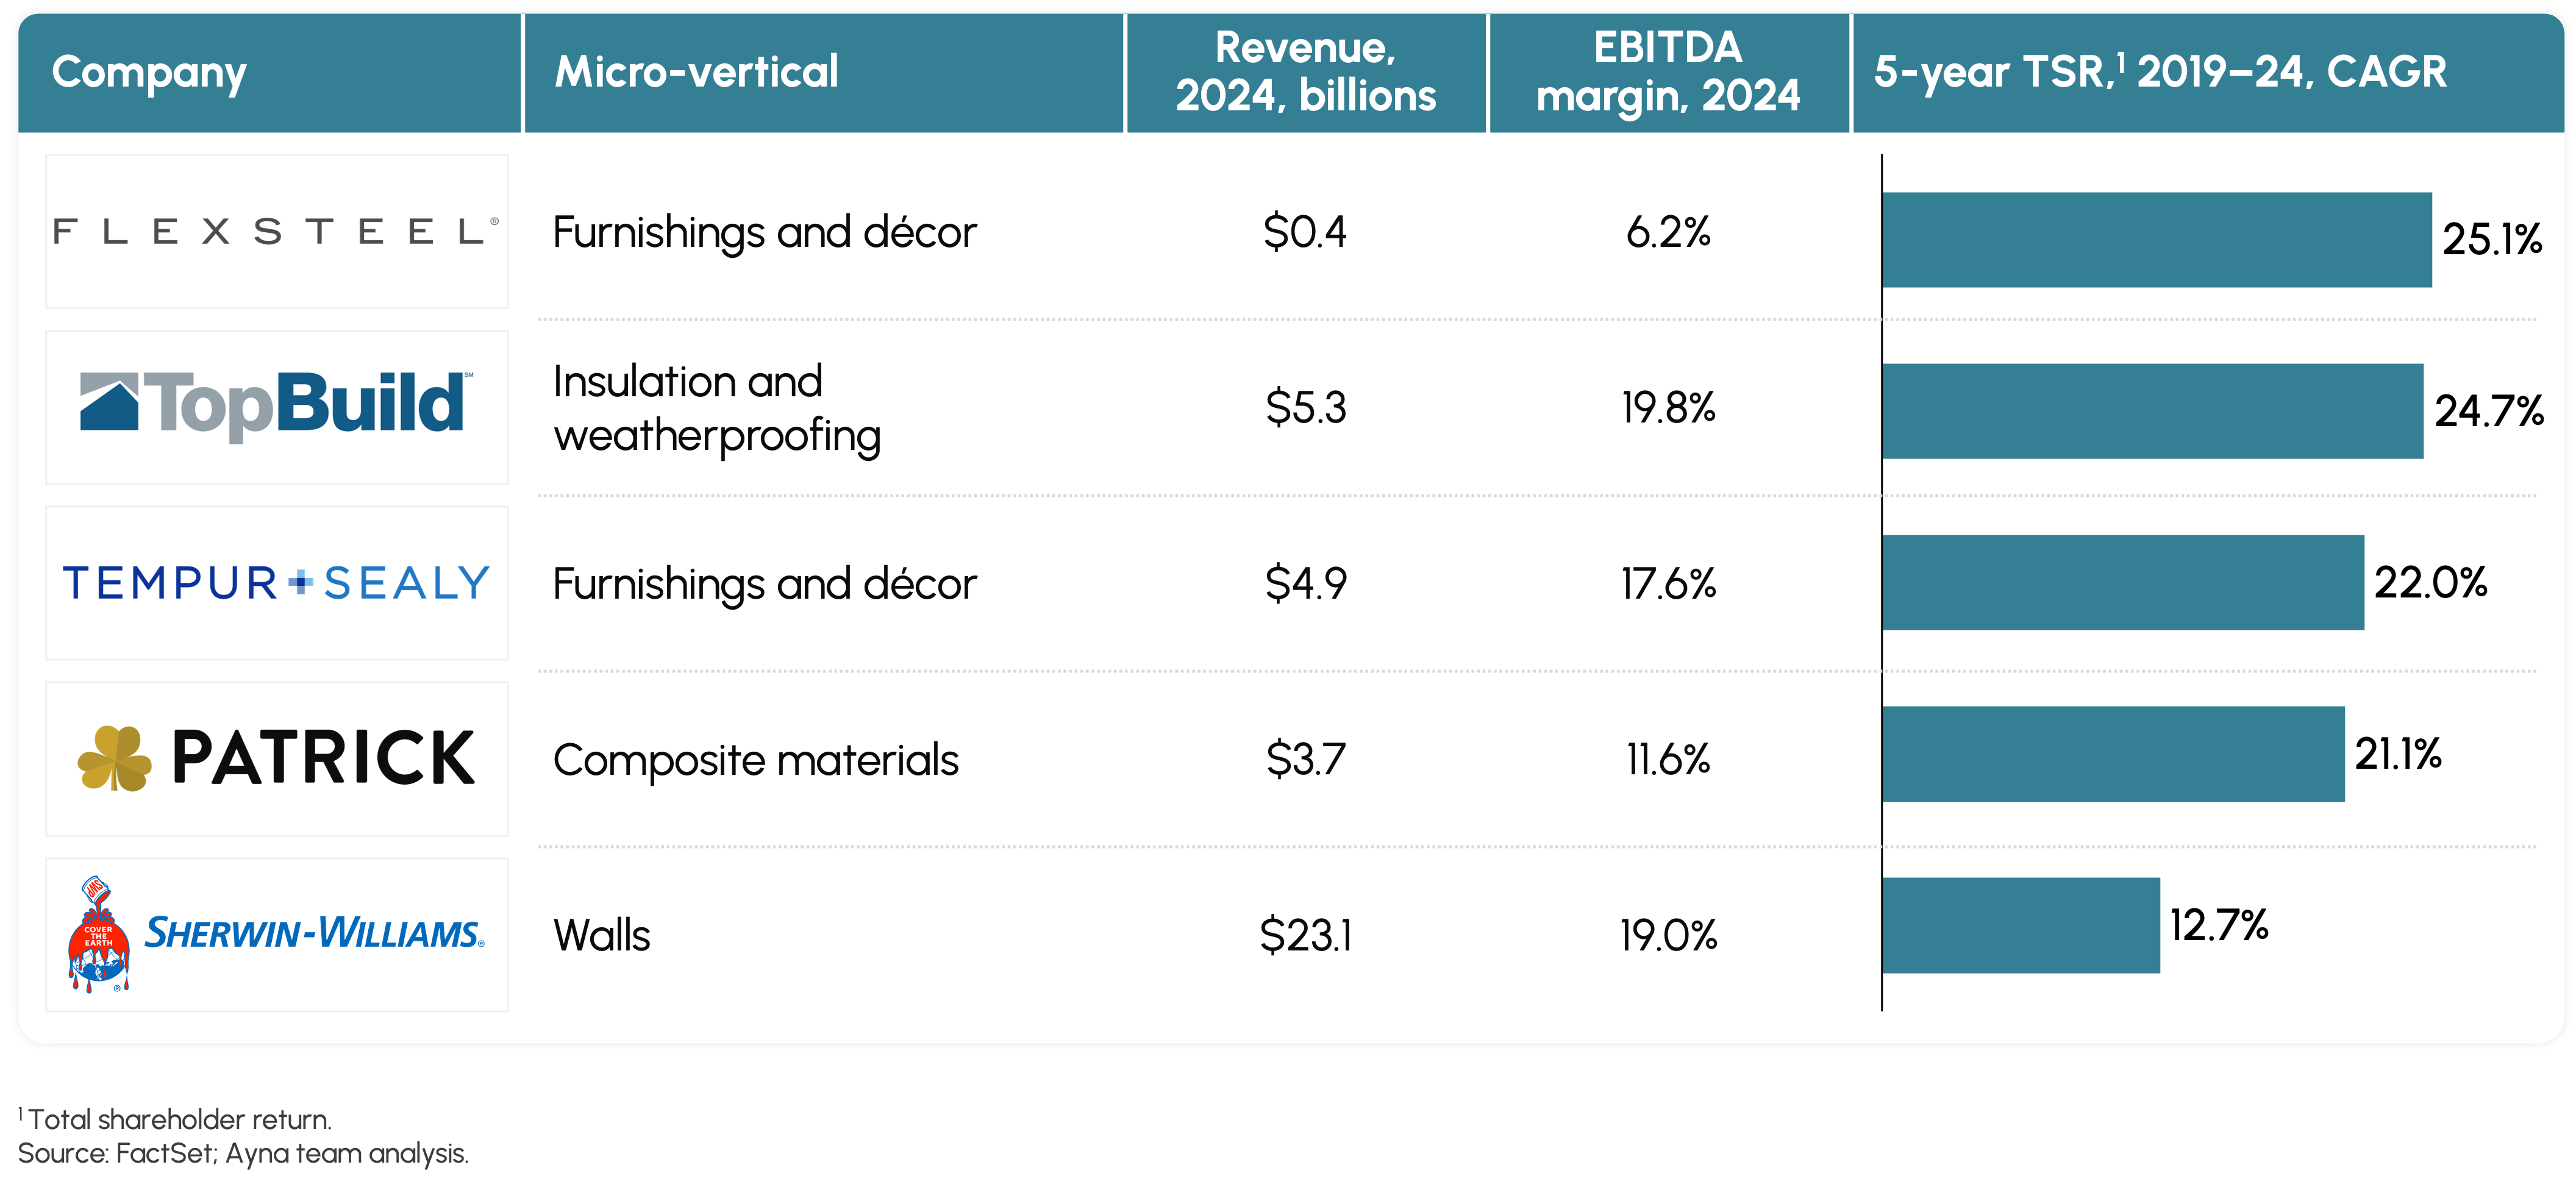
- Flexsteel, a historic American furniture brand best known for their patented Blue Steel Spring Technology, is the smallest of the five (revenues of $0.4 billion) but posted the largest growth rate of TSR, at 25.1%. Flexsteel leverages product innovation and unique customer-driven insights, evidenced by 237 unique SKUs in the first quarter of 2025. Additional growth comes from omnichannel expansion. The company keeps its supply chain agile to manage tariff risks and in the fourth quarter of 2024 reduced its inventory by $25 million.
- TopBuild, a leading installer and distributor of insulation products, had the largest EBITDA margins, at 19.8%. The company prioritizes M&A and leverages its technology platform to develop stable revenue segments. Recent acquisitions added $153 million to its top line. Resilience comes from a diversified service model; 25% of recurring revenue comes from specialty distribution. TopBuild’s technology platform provides real-time analytics for pricing, productivity, and lead generation.
- Tempur Sealy, a global leader in the design, manufacture, and distribution of retail mattresses and bedding products, focuses on product innovation and customer-centric marketing and distribution. Innovations include pressure relief technology and late-stage customization. Other gains come from omnichannel expansion, including direct-to-consumer sales. Focusing operations on enhancing supply contracts, improving labor productivity, and optimizing logistics yielded a 200-point improvement in gross margin.
- Patrick Industries, a leading provider of component solutions for various end markets, including housing, and a key supplier for housing manufacturers, has leveraged M&A to enhance its revenue growth; acquisitions contributed four percentage points of the company’s 7% total revenue growth in the first quarter of 2025. Automation helped improve gross margin by more than 90 basis points in the first quarter of 2025.
- Sherwin-Williams, a leader in the manufacture, distribution, and sale of paints, coatings, and related products, earned the greatest revenue, $23.1 billion, and achieved the second-highest EBITDA margin, 19.0%. The company maintains a customer-centric approach, launched a consumer app in 2024, and invested in dedicated sales representatives. In the first quarter of 2025, its selling, general, and administrative expenses (SG&A) were only in the mid-teens as a percent of total expenses.
Lessons for Companies.
The examples of top-performing interior and exterior players point to five shared themes: product differentiation, operational excellence, digital transformation, strategic M&A, and channel strategy. Others in the industry can benefit from investigating each of these and considering how each theme might play out in their own company.
Product Differentiation. BlueLinx, Builders FirstSource, FlexSteel, and Tempur Sealy all differentiated their products and services, becoming a valued source for their customers. This enables higher margins and increases customer loyalty, making the company more resilient throughout the business cycle. Companies can apply this theme by doubling down on specialty products, value-added manufacturing, or proprietary innovations.
Operational Excellence. Beacon, Louisiana-Pacific, and TopBuild have track records of operational excellence. They control costs and quality to enable robust margins, satisfy customers, and keep the company lean enough to weather downturns in demand. Companies pursue operational excellence by maintaining a sustained focus on cost control, productivity, and margin stability. Key metrics to monitor include facility footprints, workforce efficiency, and freight and fulfillment costs.
Digital Transformation. Beacon, Builders FirstSource, Tempur Sealy, and TopBuild have engaged in digital transformations to increase sales and profitability. They understand that well-planned, carefully executed transformations are growth enablers and margin levers. Companies wanting to benefit from a digital transformation need to take a strategic approach that pursues business objectives such as growth and customer engagement. Digital tools could include e-commerce platforms and pricing analytics.
Strategic M&A. Beacon, BlueLinx, FlexSteel, Louisiana-Pacific, and TopBuild drive profitable growth with their strategic approach to M&A. They manage their business portfolio, considering how an acquisition or divestment could deliver growth while maintaining or increasing margins. Companies can shape their business portfolio by regularly assessing each business’s contribution to profitability. They can target acquisitions that would expand capabilities, product lines, and geography served. Divesting lower-margin businesses is equally important.
Channel Strategy. Beacon, FlexSteel, and Tempur Sealy are strategic about distribution. They are extending their reach with omnichannel distribution, private labels, and integrated marketing. They are investing in customer-facing technology and talent to improve customer conversion and brand pull. Companies that want to learn from their example should investigate omnichannel distribution, including opportunities to pursue direct-to-consumer sales or B2B online channels. They can investigate customer-facing investments that could improve conversion and brand pull.
Micro-Verticals to Watch
Investors interested in the building supplies industry will want to direct their money to companies with potential to deliver value. In general, the odds of success will be greater in a high-opportunity micro-vertical.
Based on our experience as consultants and investors, we have found the following criteria to be helpful for guiding the selection of high-opportunity micro-verticals:
- Market size. How big is the micro-vertical? Is it large enough to expand into or invest in value enhancement initiatives?
- Demand and growth drivers. How resilient is demand? What is the growth outlook?
- Product innovation potential. What are the emerging trends? Are there opportunities to introduce new or premium products based on these trends?
- Digital innovation potential. Can technology improve the business (e.g., with smart products, digital sales, automation)? Can AI help unlock new opportunities or improve efficiency?
- Programmatic M&A. Is the market fragmented and ripe for consolidation? Do valuations and financing markets support the consolidators?
- Value chain leverage. Where is the leverage in the value chain? Who has pricing power?
- Supply chain risks. What are the risks related to raw-material pricing and logistics? What is the impact of trade and immigration policy changes on labor and goods?
- Operational enhancement potential. Are there structural constraints to margin improvement? Do financial backers see a substantial opportunity for operational enhancement?
Opportunities in Exteriors
Within building exteriors, the windows and doors micro-vertical clearly stands out. The green squares in Table 2 indicate that this micro-vertical offers strong opportunities based on its size ($40 billion), growth rate (5.4%), and the other criteria except value chain leverage. The other micro-verticals present mixed or moderate opportunities (yellow) or low opportunities (red) for at least one other criterion.
Table 2. Assessment of Opportunities in Exteriors
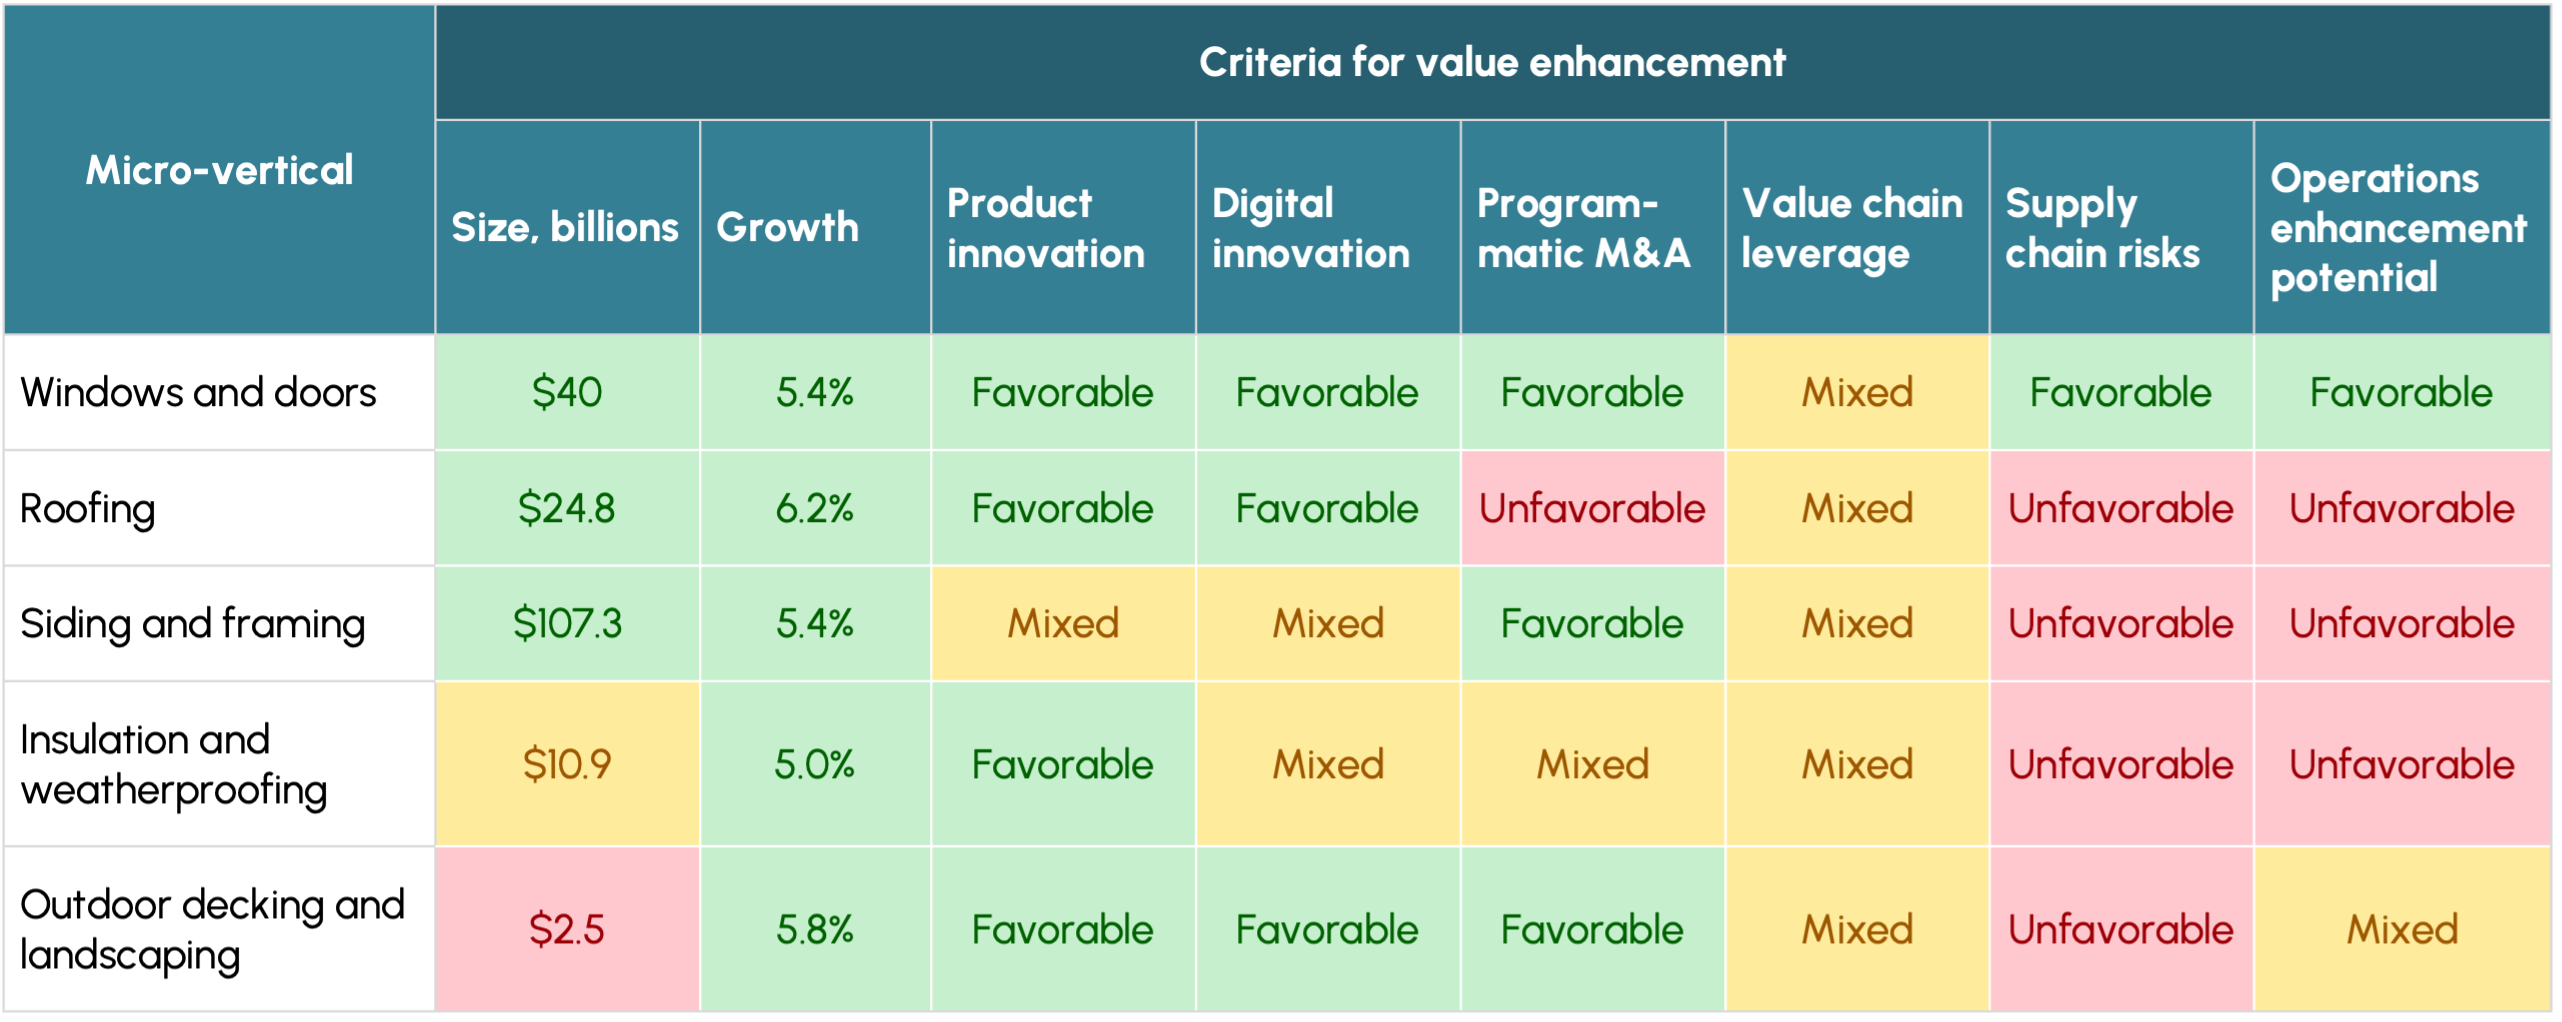
Windows and doors present great opportunities for innovation. Technology is a key factor, enabling smart glass technology, smartphone-controlled features, and automatic weather response. In addition, windows and doors can be made with eco-friendly materials. There is high potential for M&A because the market for windows and doors is highly fragmented, and private equity has strong buy-and-build interest. In terms of supply chain risks, the windows and doors micro-vertical is less volatile than the others because it relies less on lumber. And supply chain management and material sourcing boost the opportunity to enhance operations. Value chain leverage in windows and doors is a moderate enhancer of value because branded products hold strong pricing power, especially in premium segments.
Examining the performance of windows and doors points to other advantages of this micro-vertical: it is an essential product, and much of its business is for repairs and remodeling. In general, repair and remodeling business moderates the cyclicality of real estate by providing a stream of income as items wear out.
Opportunities in Interiors
The only micro-vertical for which the opportunity is at least mixed for all the criteria is flooring (Table 3). Flooring scores high on size ($74.6 billion), growth (6.8%), product innovation, digital innovation, and programmatic M&A. Value chain leverage, supply chain risks, and operations enhancement potential point to a mixed or moderate opportunity because raw-material suppliers have leverage, a few of the inputs are subject to sharp price fluctuations, and price competition is fierce, which limits opportunities to gain from operations improvements.
Table 3. Assessment of Opportunities in Interiors

As with windows and doors, flooring demand is not very cyclical because flooring is essential to a building’s function. In addition, resilient flooring materials like vinyl, laminate, and luxury vinyl tile (LVT) have made flooring projects more accessible to consumers, further smoothing demand growth. In value-driven renovations and maintenance, flooring is prioritized to boost property appearance and value.
***
The building products industry is an exciting arena for businesses and their investors. The industry is cyclical yet resilient. In the current cycle, a strong recovery has not yet followed the post-COVID dip associated with high interest rates and costs. Uncertainties in the industry’s environment have pushed back hopes for a market rebound within a year’s time. However, there are bright spots: nonresidential construction is strong, and even the residential market is showing early signs of growth.
How to make the most of opportunities before the upturn? One approach is to follow the example of the companies that have been outperforming their peers with strategies that include product innovation, digital innovation, customer centricity, and programmatic M&A. Investors wanting to select micro-verticals with the greatest value enhancement opportunity might investigate companies in windows and doors, kitchen cabinets and countertops, flooring, or roofing.